Spruce budworm affects more than just spruce trees
Fri, Jan 09, 2026
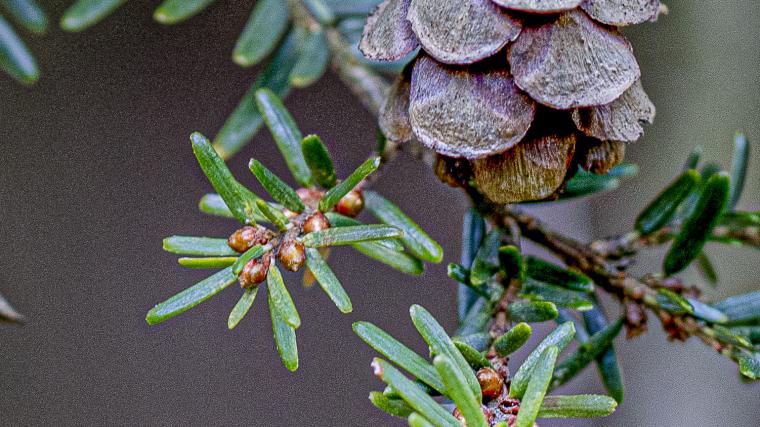
Insect pests, like emerald ash borers and spongy moths, pose a significant threat to forests in North America. Management of these pests depends on information about which trees are at greatest risk and which treatments are likely to be most effective. Outbreaks of spruce budworm can devastate fir and spruce forests in the northeastern U.S. and Canada, but the risk to other tree species has not been well documented. Researchers in Maine used Nature’s Notebook observations and tree ring data to show that spruce budworms also feed on eastern hemlock trees, which leaf out at the same time as fir and spruce trees. Understanding the risk to eastern hemlock trees is important because the trees play a unique role in eastern forests and are also harvested commercially.