The USA-NPN produces and distributes a growing suite of historical, real-time, and forecasted phenology map products using gridded temperature data and based on several predictive phenology models.
Predicting when a species will undergo a phenological transition at a particular location – for example, transitioning from closed flower buds to open flowers – has great value for a wide range of short-term natural resource management applications, including scheduling invasive species and pest detection and control activities, planning recreational activities, anticipating allergy outbreaks, and planning agricultural harvest dates.
Historical phenological transition dates also have value for providing context for current phenology observations and for documenting how conditions have changed in recent years.
Modeled historical, real-time, and forecasted phenology map products created and distributed by the USA-NPN include:
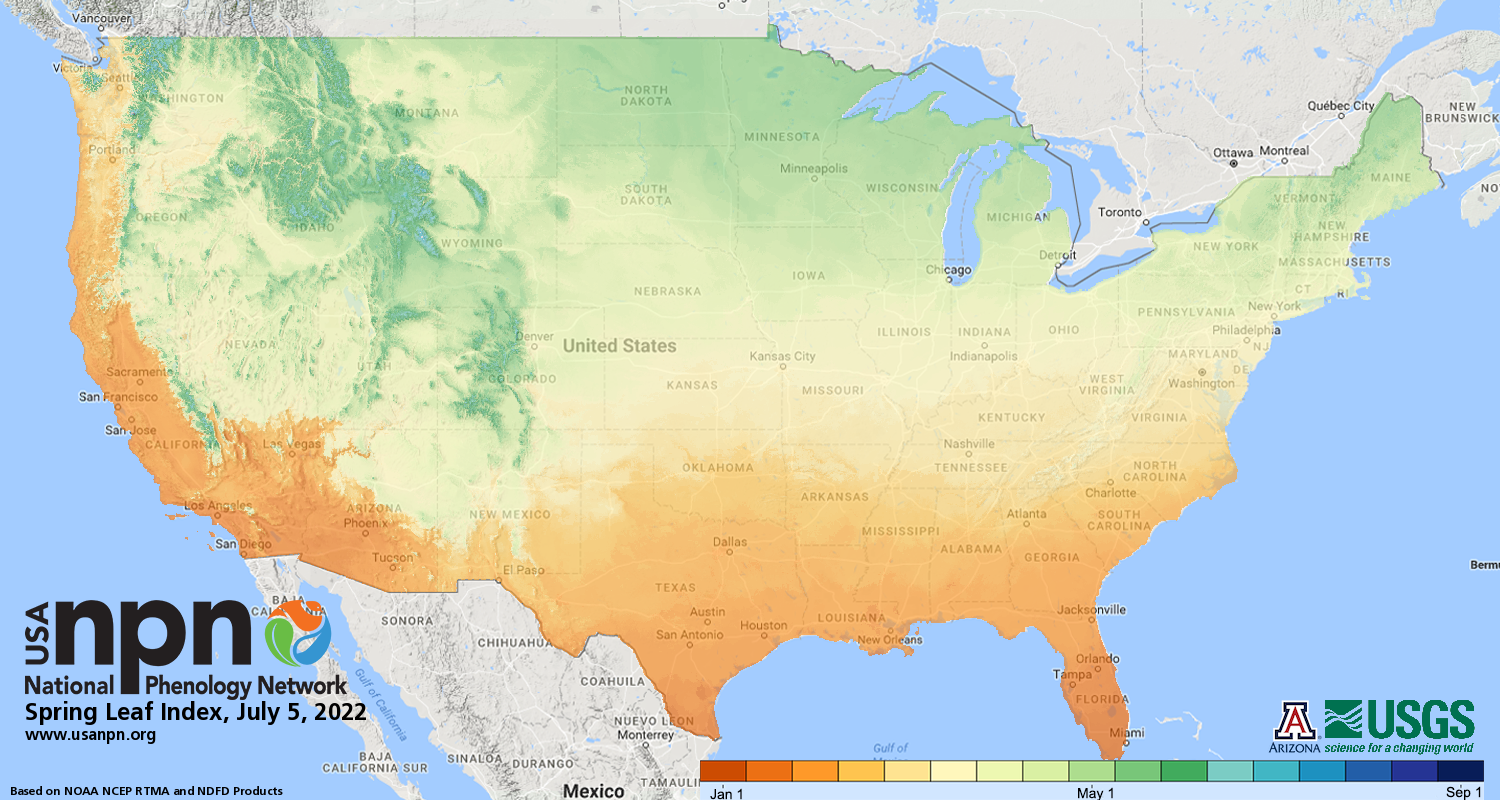
Spring Indices
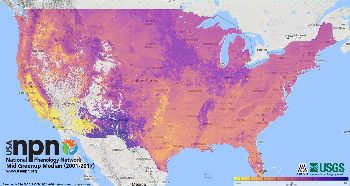
Historical, contemporary, and short-term forecast maps of the Spring Indices. The Extended Spring Indices have been used as an indicator of climate change by both the Environmental Protection Agency and the National Climate Assessment. The product suite supports understanding of spatial patterns in the timing of spring, including short-term forecasts to support resource management.
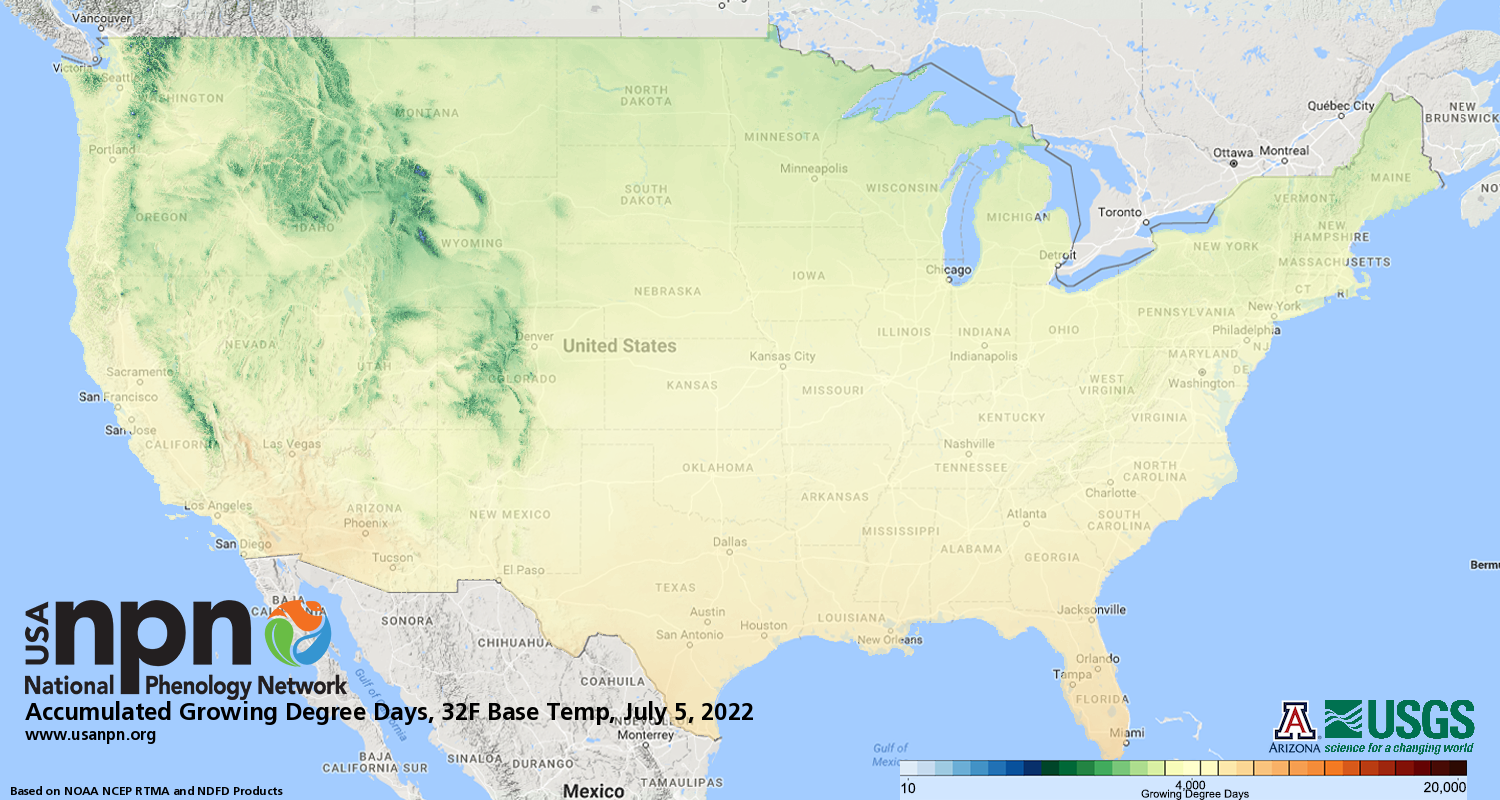
Accumulated Growing Degree Days
Contemporary and short-term forecast maps of Accumulated Growing Degree Days (AGDD). Accumulated growing degree days can be used to predict life cycle transitions in plants and insects.
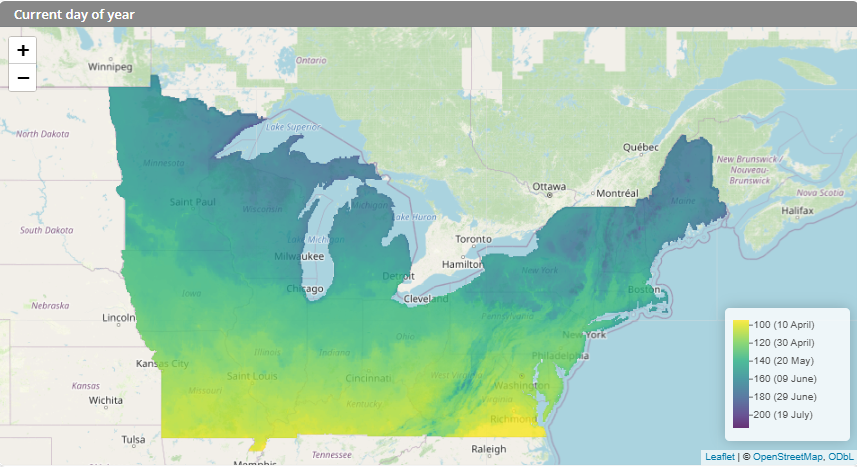
Thermal Calendars
An interactive tool providing high-resolution maps of thermal accumulation in the northeastern U.S. Maps indicate the date on which 50 growing degree day thresholds have been reached in the current year and information about how conditions in the current year differ from the historical average. This information can support monitoring and management activities for insect pests in the region.
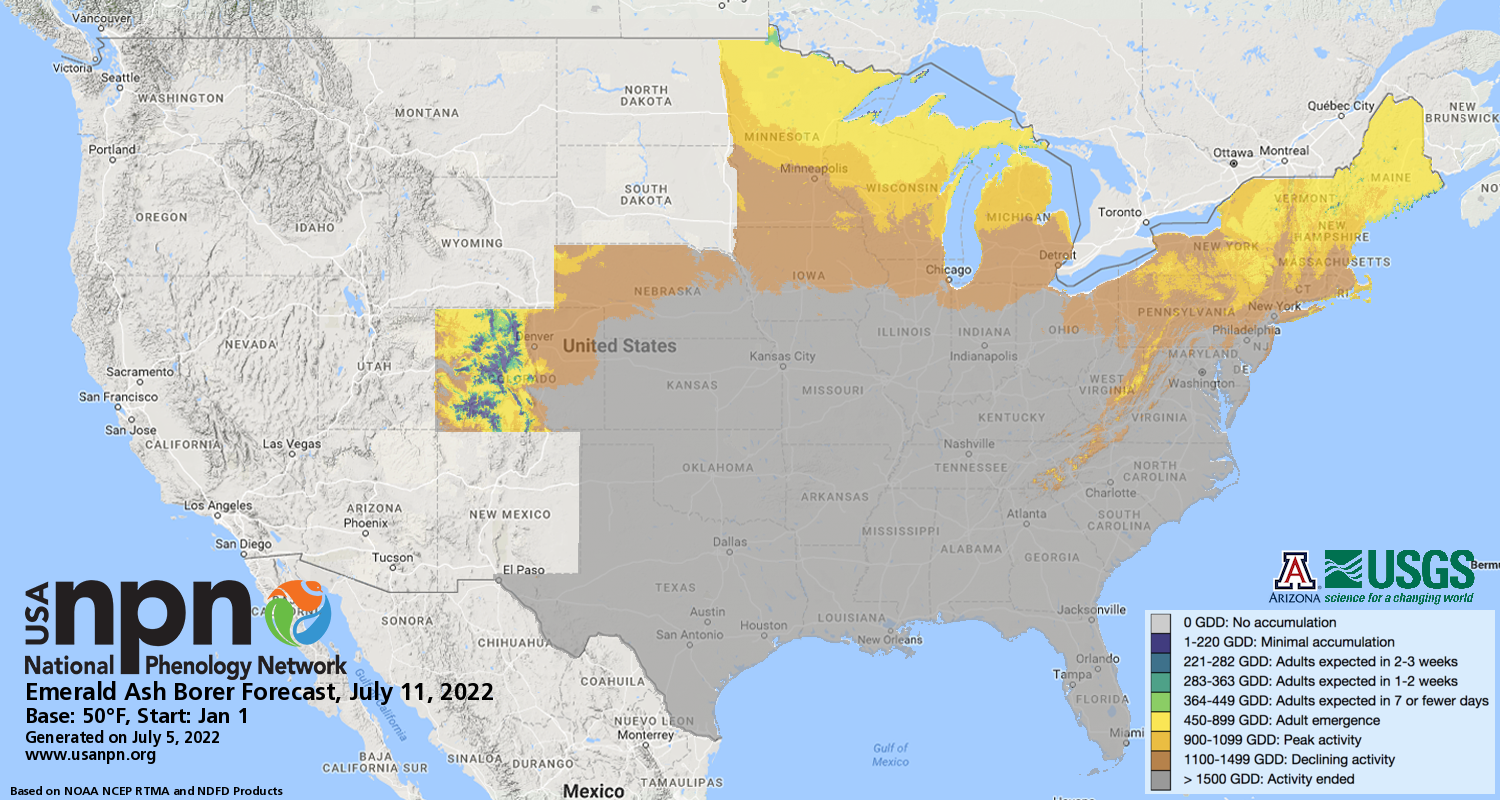
Pheno Forecasts
Pheno Forecasts, which provide 6-day forecasts of invasive pest activity to inform management. Pheno Forecast maps estimate when insects and invasive plants will be in their vulnerable stages.
Land Surface Phenology
Land Surface Phenology maps are derived from MODIS 6 land surface data. Satellite observations can be linked to in-situ observations to help understand vegetation dynamics across large spatial scales.