

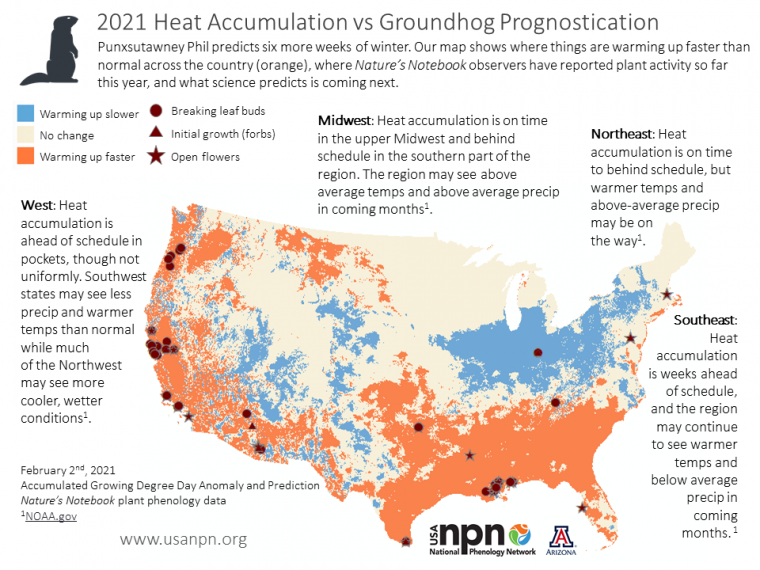
Punxsutawney Phil predicted six more weeks of winter! However, our maps of heat accumulation provide a more scientific look at how much heat has accumulated so far this year, and what's next.

Nature's Notebook observers reported some oddly-timed flowering for species across the country this fall.
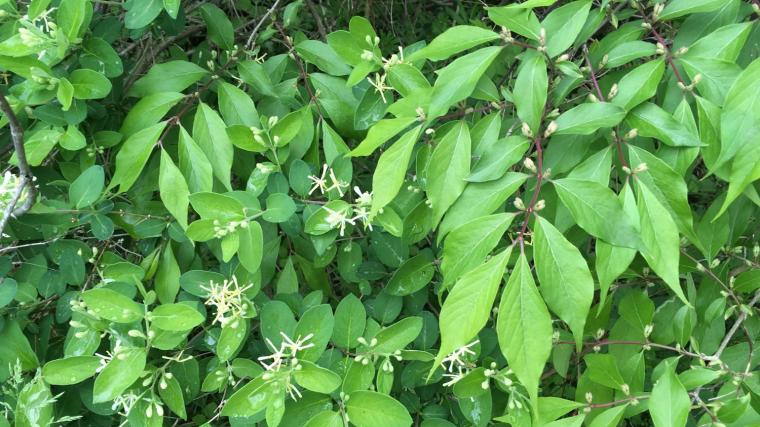
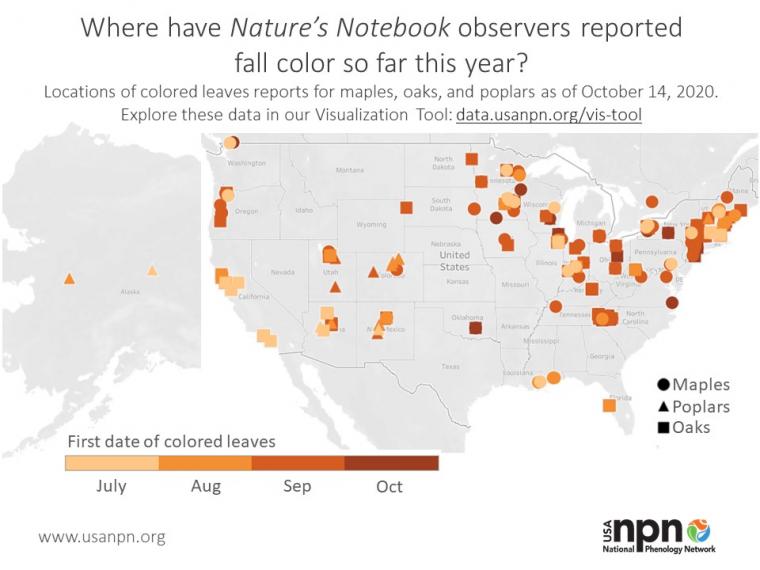
Hundreds of Nature's Notebook observers across the country are tracking the fall leaf color of plants including maples, oaks, and poplars. On our map below, you can see that while there is a range in the start of fall leaf color in all regions this year.
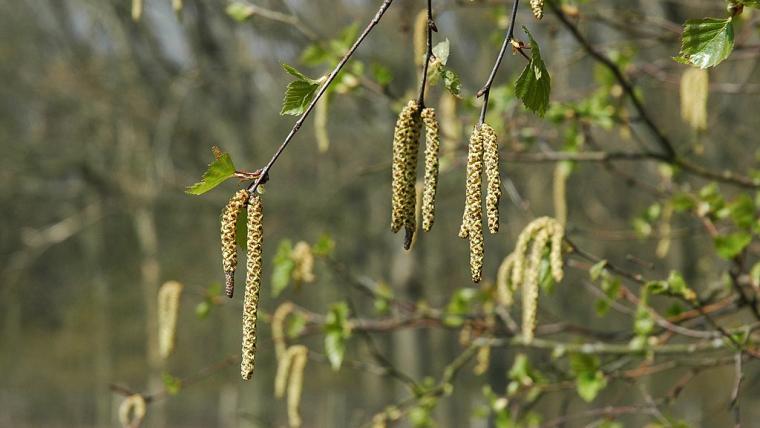
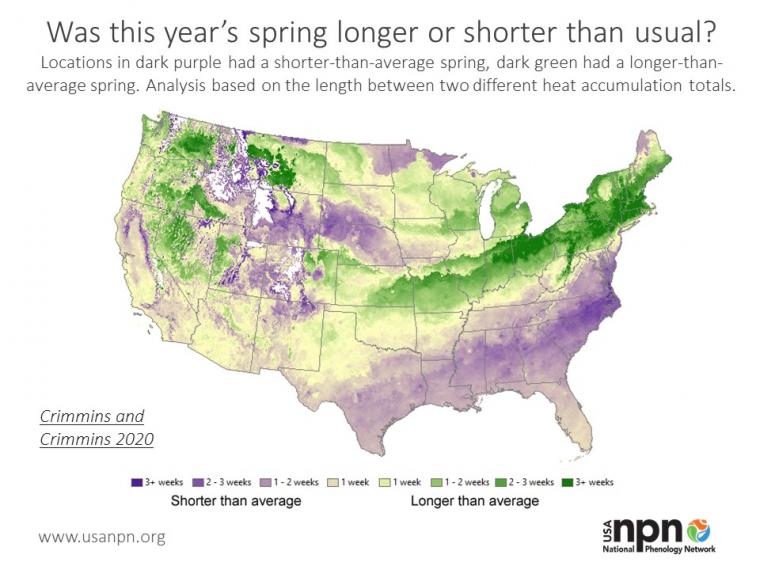
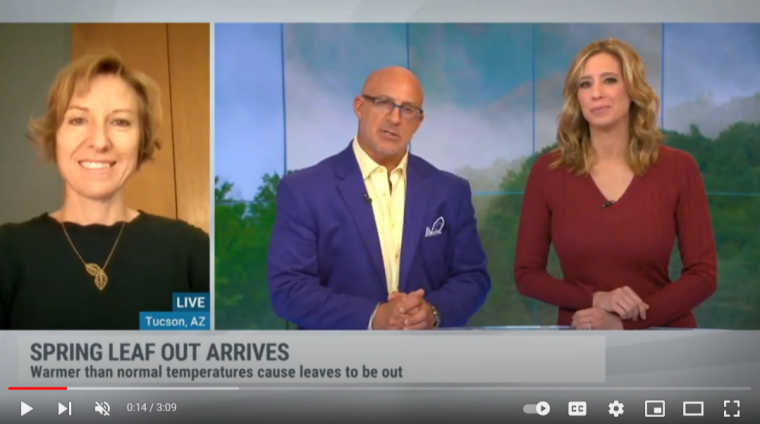
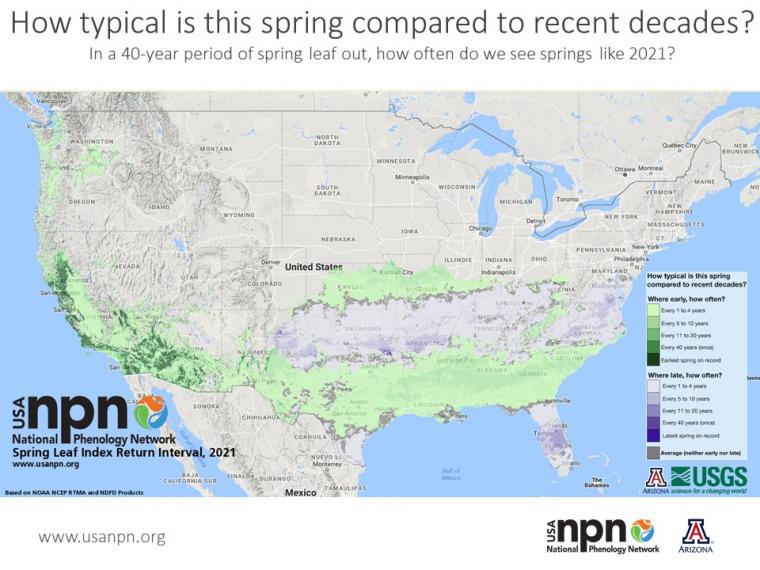
Spring leaf out is off to an early start this year in much of the Southeast. USA-NPN's Director Theresa Crimmins joined Jim Cantore and Stephanie Abrams on The Weather Channel on January 23, 2020 to talk about the implications of an early spring. Some locations are seeing spring leaf out three weeks ahead of normal (a long-term average of 1981-2010).