The USA-NPN Pheno Forecasts indicate when insect pests and invasive species will reach life stages critical for monitoring and management in your region.
Pheno Forecast maps predict the timing of target life cycle stages in key species to support agriculture and natural resource management. For insect pest species, Pheno Forecasts are based on published growing degree day (GDD) thresholds for life cycle stages. The life cycle stages forecasted are those during which management actions are most effective. These maps are updated daily and available 6 days in the future.
Download the Pheno Forecast information sheet to learn more.
Help us improve these maps! Our Pheno Forecast map products are still in development, and we seek input on their performance in your area. Share your feedback on these products.

Emerald Ash Borer Adult Emergence Forecast

Buffelgrass Current Day Forecast
FIND OUT WHEN TO TREAT YOUR TREES FOR PESTS
Are you concerned about pests damaging your plants? Our insect pest maps help determine when your site will reach critical heat accumulation for the detection, management, and treatment of insect pests. Maps are available via the USA-NPN visualization tool and on the individual species landing pages below.
Insect and invasive plant species and phenological events for which USA-NPN offers Pheno Forecasts:
|
Species |
Life stage predicted |
GDD threshold, accumulation method (source) |
GDD start date, base temperature |
|
Apple maggot (Rhagoletis pomonella Walsh) |
Adult emergence |
900 GDD, simple averaging (Wise et al. 2010) |
1 Jan., 10°C (50°F) |
|
Asian longhorned beetle (Anoplophora glabripennis Motschulsky) |
First adults emerged |
689.75 GDD, double sine (Kappel et al. 2017; Trotter in prep) |
1 Jan., 10°C (50°F) |
| Asian longhorned beetle (Anoplophora glabripennis Motschulsky) | 25% Adults emerged | 720 GDD, double sine (Kappel et al. 2017; Trotter in prep) | 1 Jan., 10°C (50°F) |
| Asian longhorned beetle (Anoplophora glabripennis Motschulsky) | 50% Adults emerged | 820 GDD, double sine (Kappel et al. 2017; Trotter in prep) | 1 Jan., 10°C (50°F) |
| Asian longhorned beetle (Anoplophora glabripennis Motschulsky) | > 75% Adults emerged | 1973 GDD, double sine (Kappel et al. 2017; Trotter in prep) | 1 Jan., 10°C (50°F) |
|
Bagworm (Thyridopteryx ephemeraeformis Haworth) |
Caterpillar emergence |
600 GDD, simple averaging (Cornell Cooperative Extension 2010) |
1 Mar., 0°C (32°F) |
|
Bronze birch borer (Agrilus anxius Gory) |
Adult emergence |
450 GDD, double sine (Herms et al. 2004) |
1 Jan., 10°C (50°F) |
|
Buffelgrass (Pennisetum ciliare Linnaeus) |
50% greenness may occur in 1-2 weeks |
1-1.7 inches accumulated Precipitation over 24-day rolling timeframe |
NA |
|
Buffelgrass (Pennisetum ciliare Linnaeus) |
50% greenness will likely occur in 1-2 weeks |
> 1.7 inches accumulated Precipitation over 24-day rolling timeframe |
NA |
|
Eastern tent caterpillar (Malacosoma americanum Fabricius) |
Caterpillar emergence |
90–190 GDD, simple averaging (Cornell Cooperative Extension 2010) |
1 Mar., 10°C (50°F) |
|
Emerald ash borer (Agrilus planipennis Fairmaire) |
Adult emergence |
391 GDD, single triangle (DDRP) |
1 Jan., 12°C (54°F) |
|
Emerald ash borer (Agrilus planipennis Fairmaire) |
Egg hatch |
830 GDD, single triangle (DDRP) |
1 Jan., 12°C (54°F) |
|
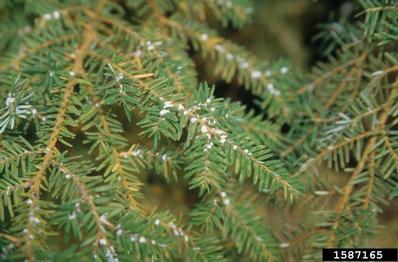
Hemlock woolly adelgid (Adelges tsugae Annand) |
Presence of eggs |
25 GDD, simple averaging (M. W. and S. L., pers. comm.) |
1 Jan., 0°C (32°F) |
|
Hemlock woolly adelgid (Adelges tsugae Annand) |
Presence of active nymphs |
1,000 GDD, simple averaging (M. W. and S. L., pers. comm.) |
1 Jan., 0°C (32°F) |
|
Japanese beetle (Popillia japonica Newman) |
Adult emergence |
873 GDD, single triangle (DDRP) |
1 Jan., 10°C (50°F) |
|
Japanese beetle (Popillia japonica Newman) |
Egg hatch |
1,543 GDD, single triangle (DDRP) |
1 Jan., 10°C (50°F) |
|
Lilac borer (Podosesia syringae Harris) |
Adult emergence |
500 GDD, double sine (Herms 2004) |
1 Jan., 10°C (50°F) |
|
Magnolia scale (Neolecanium cornuparvum Thro) |
Crawler emergence |
1938 GDD, double sine (Herms 2004) |
1 Jan., 10°C (50°F) |
|
Pine needle scale (Chionaspis pinifoliae Fitch) |
Crawler emergence |
298–448 GDD, simple averaging (Cornell Cooperative Extension 2010) |
1 Mar., 10°C (50°F) |
|
Red Brome (Bromus rubens) |
Flowering |
1441 GDD, Simple averaging (Prevéy et al. 2024) |
10 Dec., 23°F |
|
Red Brome (Bromus rubens) |
Senescence |
1049 GDD, Simple averaging (Prevéy et al. 2024) |
1 Jan., 32°F |
|
Spongy moth (Lymantria dispar Linnaeus) |
Caterpillar emergence |
571 GDD, double sine (Russo et al. 1993) |
1 Jan., 3°C (37.5°F) |
| Spotted lanternfly (Lycorma deliculata) | Egg hatch | 364 GDD, single triangle (DDRP, Barker and Coop 2024) | 1 Jan., 50°F |
| Spotted lanternfly (Lycorma deliculata) | Adult emergence | 1934 GDD, single triangle (DDRP, Barker and Coop 2024) | 1 Jan., 50°F |
|
Winter moth (Operophtera brumata Linnaeus) |
Caterpillar emergence |
20 GDD, simple averaging (UMass Extension 2017) |
1 Jan., 10°C (50°F) |
|
Vegetative and reproductive stages |
Various; (adapted from Ritchie 1991) |
1 Jan., 0°C (32°F) |
How are these forecasts used?
Pheno Forecast maps predict key life cycle stages in insects and invasive plant species to improve management efficacy. For insect species, Pheno Forecasts are based on published growing degree day (GDD) thresholds for key points in species life cycles. For invasive plant species, Forecasts are based on published precipitation thresholds for green-up. These key points typically represent life cycle stages when management actions are most effective. These maps are updated daily and available 6 days in the future for insects and up to 1-2 weeks for invasive plants.
Use of maps and data
Recommended citation
Format: USA National Phenology Network. [Year Published]. [Species Name] Pheno Forecast for [date as of [Date]. USA-NPN, Tucson, Arizona, USA. Dataset Accessed [Date of Access] at www.usanpn.org/data/maps/forecasts.
Example: USA National Phenology Network. 2020. Emerald Ash Borer Pheno Forecast Current Day as of June 1, 2020. USA-NPN, Tucson, Arizona, USA. Dataset Accessed 1 June 2020 at www.usanpn.org/data/maps/forecasts.
Data
The USA-NPN is currently generating Pheno Forecast maps for 12 species of insects and one invasive plant species. Pheno Forecast Maps for each species can be explored in the USA-NPN Visualization Tool and on individual species Pheno Forecast pages, linked in the table above. The data behind the insect pest maps are the USA-NPN AGDD layers (link), and maps can be readily created by binning AGDD accumulation.
Content, maps, and data accessible via usanpn.org are openly and universally available to all users. USA-NPN is not responsible for the content or the use of the data. Content may be re-used and modified with appropriate attribution (e.g., "source: USA National Phenology Network, www.usanpn.org"; see our complete Content Policy). See our Data Use Policy for suggested citation and attribution of the underlying data products.
Additional documentation
Crimmins, T.M., R.L. Marsh, J. Switzer, M.A. Crimmins, K.L. Gerst, A.H. Rosemartin, and J.F. Weltzin. 2017. USA National Phenology Network gridded products documentation. U.S. Geological Survey Open-File Report 2017–1003. doi.org10.3133/ofr20171003.
Crimmins, T.M., K.L. Gerst, D. Huerta, R. Marsh, E.E. Posthumus, A. Rosemartin, J. Switzer, J. Weltzin, L. Coop, N. Dietscher, D. Herms, S. Limbu, R.T. Trotter, & M. Whitmore. 2020. Short-term Forecasts of Pest Insect Activity Inform Management Activities. Annals of the Entomological Society of America, Volume 113, Issue 2, March 2020, Pages 139–148, https://doi.org/10.1093/aesa/saz026.
Gerst, K.L., Crimmins, T.M., Posthumus, E., Marsh, R.L., Switzer, J. and Wallace, C., 2021. The USA National Phenology Network's Buffelgrass Green‐up Forecast map products. Ecological Solutions and Evidence, 2(4), p.e12109. https://doi.org/10.1002/2688-8319.12109
Wallace, C. S., J. J. Walker, S. M. Skirvin, C. Patrick‐Birdwell, J. F. Weltzin, and H. Raichle. 2016. Mapping presence and predicting phenological status of invasive buffelgrass in southern Arizona using MODIS, climate and citizen science observation data. Remote Sens. 8, 524.
Pheno Forecast Information Sheet
Gerst, K.L., Crimmins, T.M., Posthumus, E., Marsh, R.L., Switzer, J. and Wallace, C., 2021. The USA National Phenology Network's Buffelgrass Green‐up Forecast map products. Ecological Solutions and Evidence, 2(4), p.e12109.