Due to technical difficulties, this Pheno Forecast is not currently being updated for 2026. Please check back next year for updated map status.
Red brome is an invasive grass that impacts rangelands and native desert plant and animal communities in the western US. It increases fire risk and intensity in ecosystems that are not adapted to fire.
WHAT ARE PHENO FORECASTS?
Pheno Forecast maps predict key life cycle stages in invasive and pest species, to improve management efficacy. The red brome Pheno Forecast is based on growing degree day and daylength thresholds for triggering flowering and senescence. (Senescence refers to the end of the annual cycle when the grass is no longer green.) These maps are updated daily and available 6 days in the future.
You can help verify this forecast by reporting your observations on our brome one-time reporting page. Your observations will help scientists better understand when this species is green and susceptible to treatment for locations across Arizona.
Help us improve these maps! Our Pheno Forecast map products are still in development, and we seek input on their performance in your area. Give your feedback at the bottom of the page.
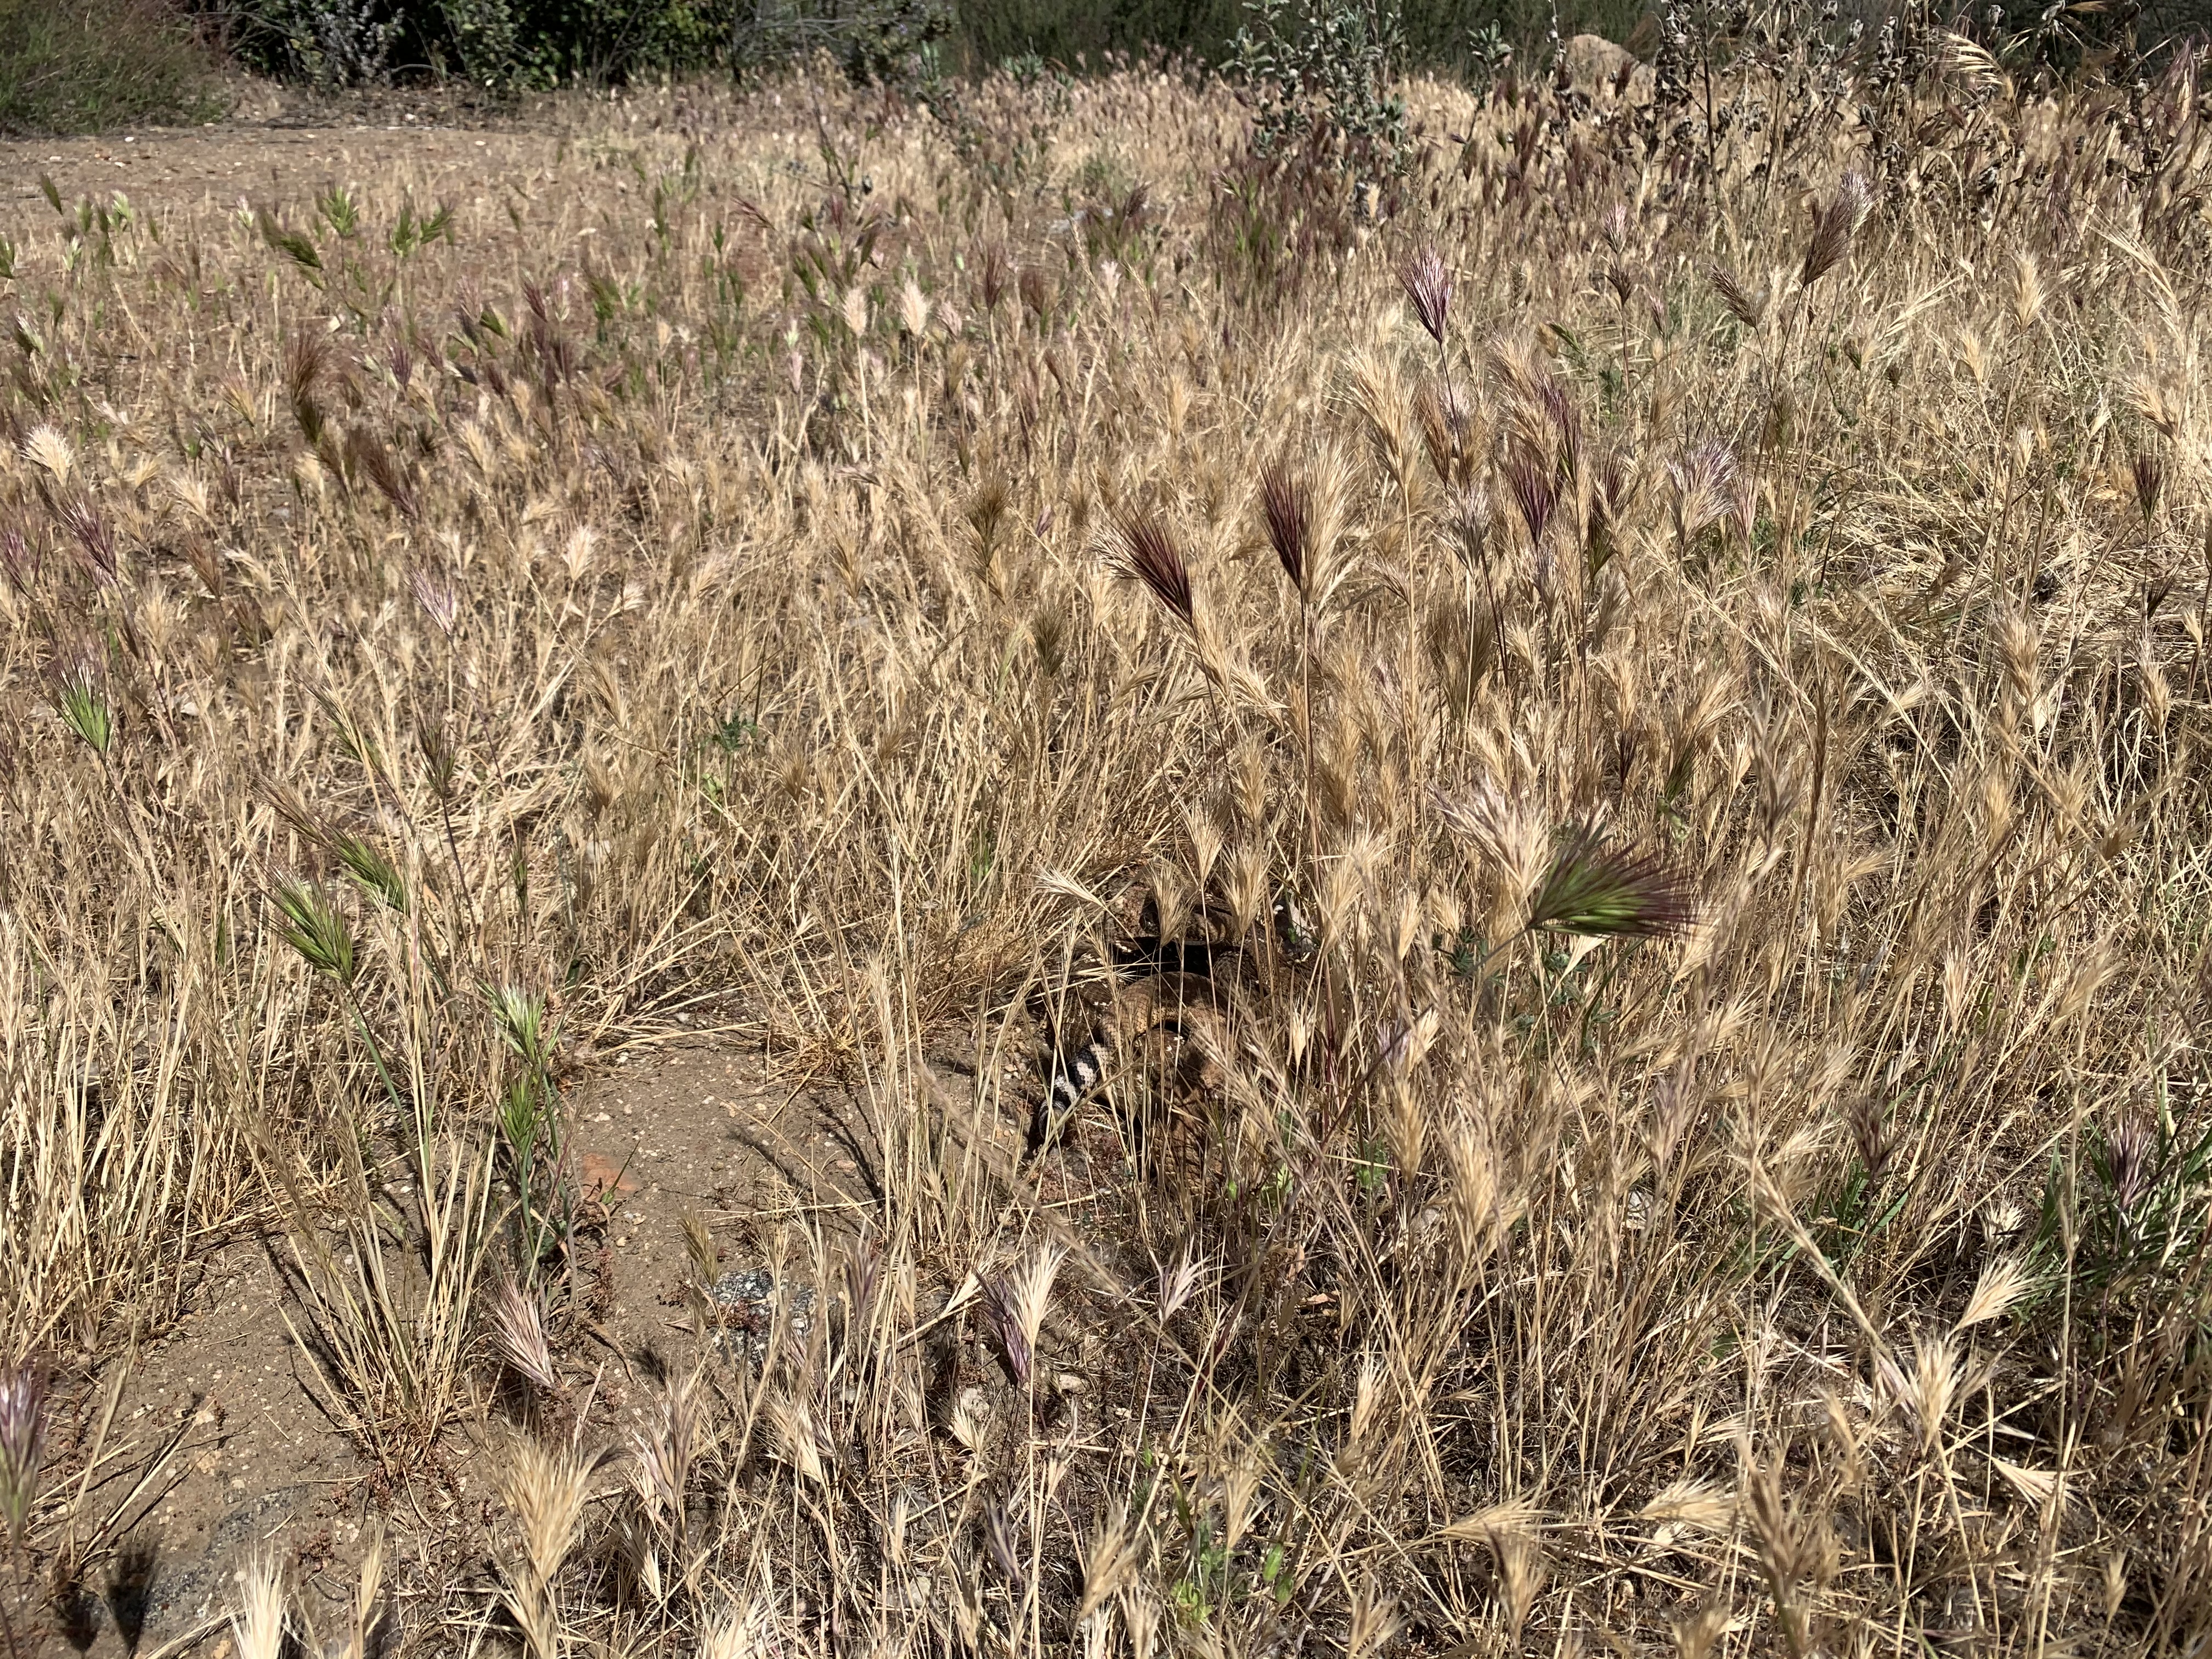
Red brome (Bromus rubens) originates in the Mediterranean and was introduced to the western US in 1880. The presence of red brome dramatically alters ecosystems, degrades rangelands and increases fire risk.
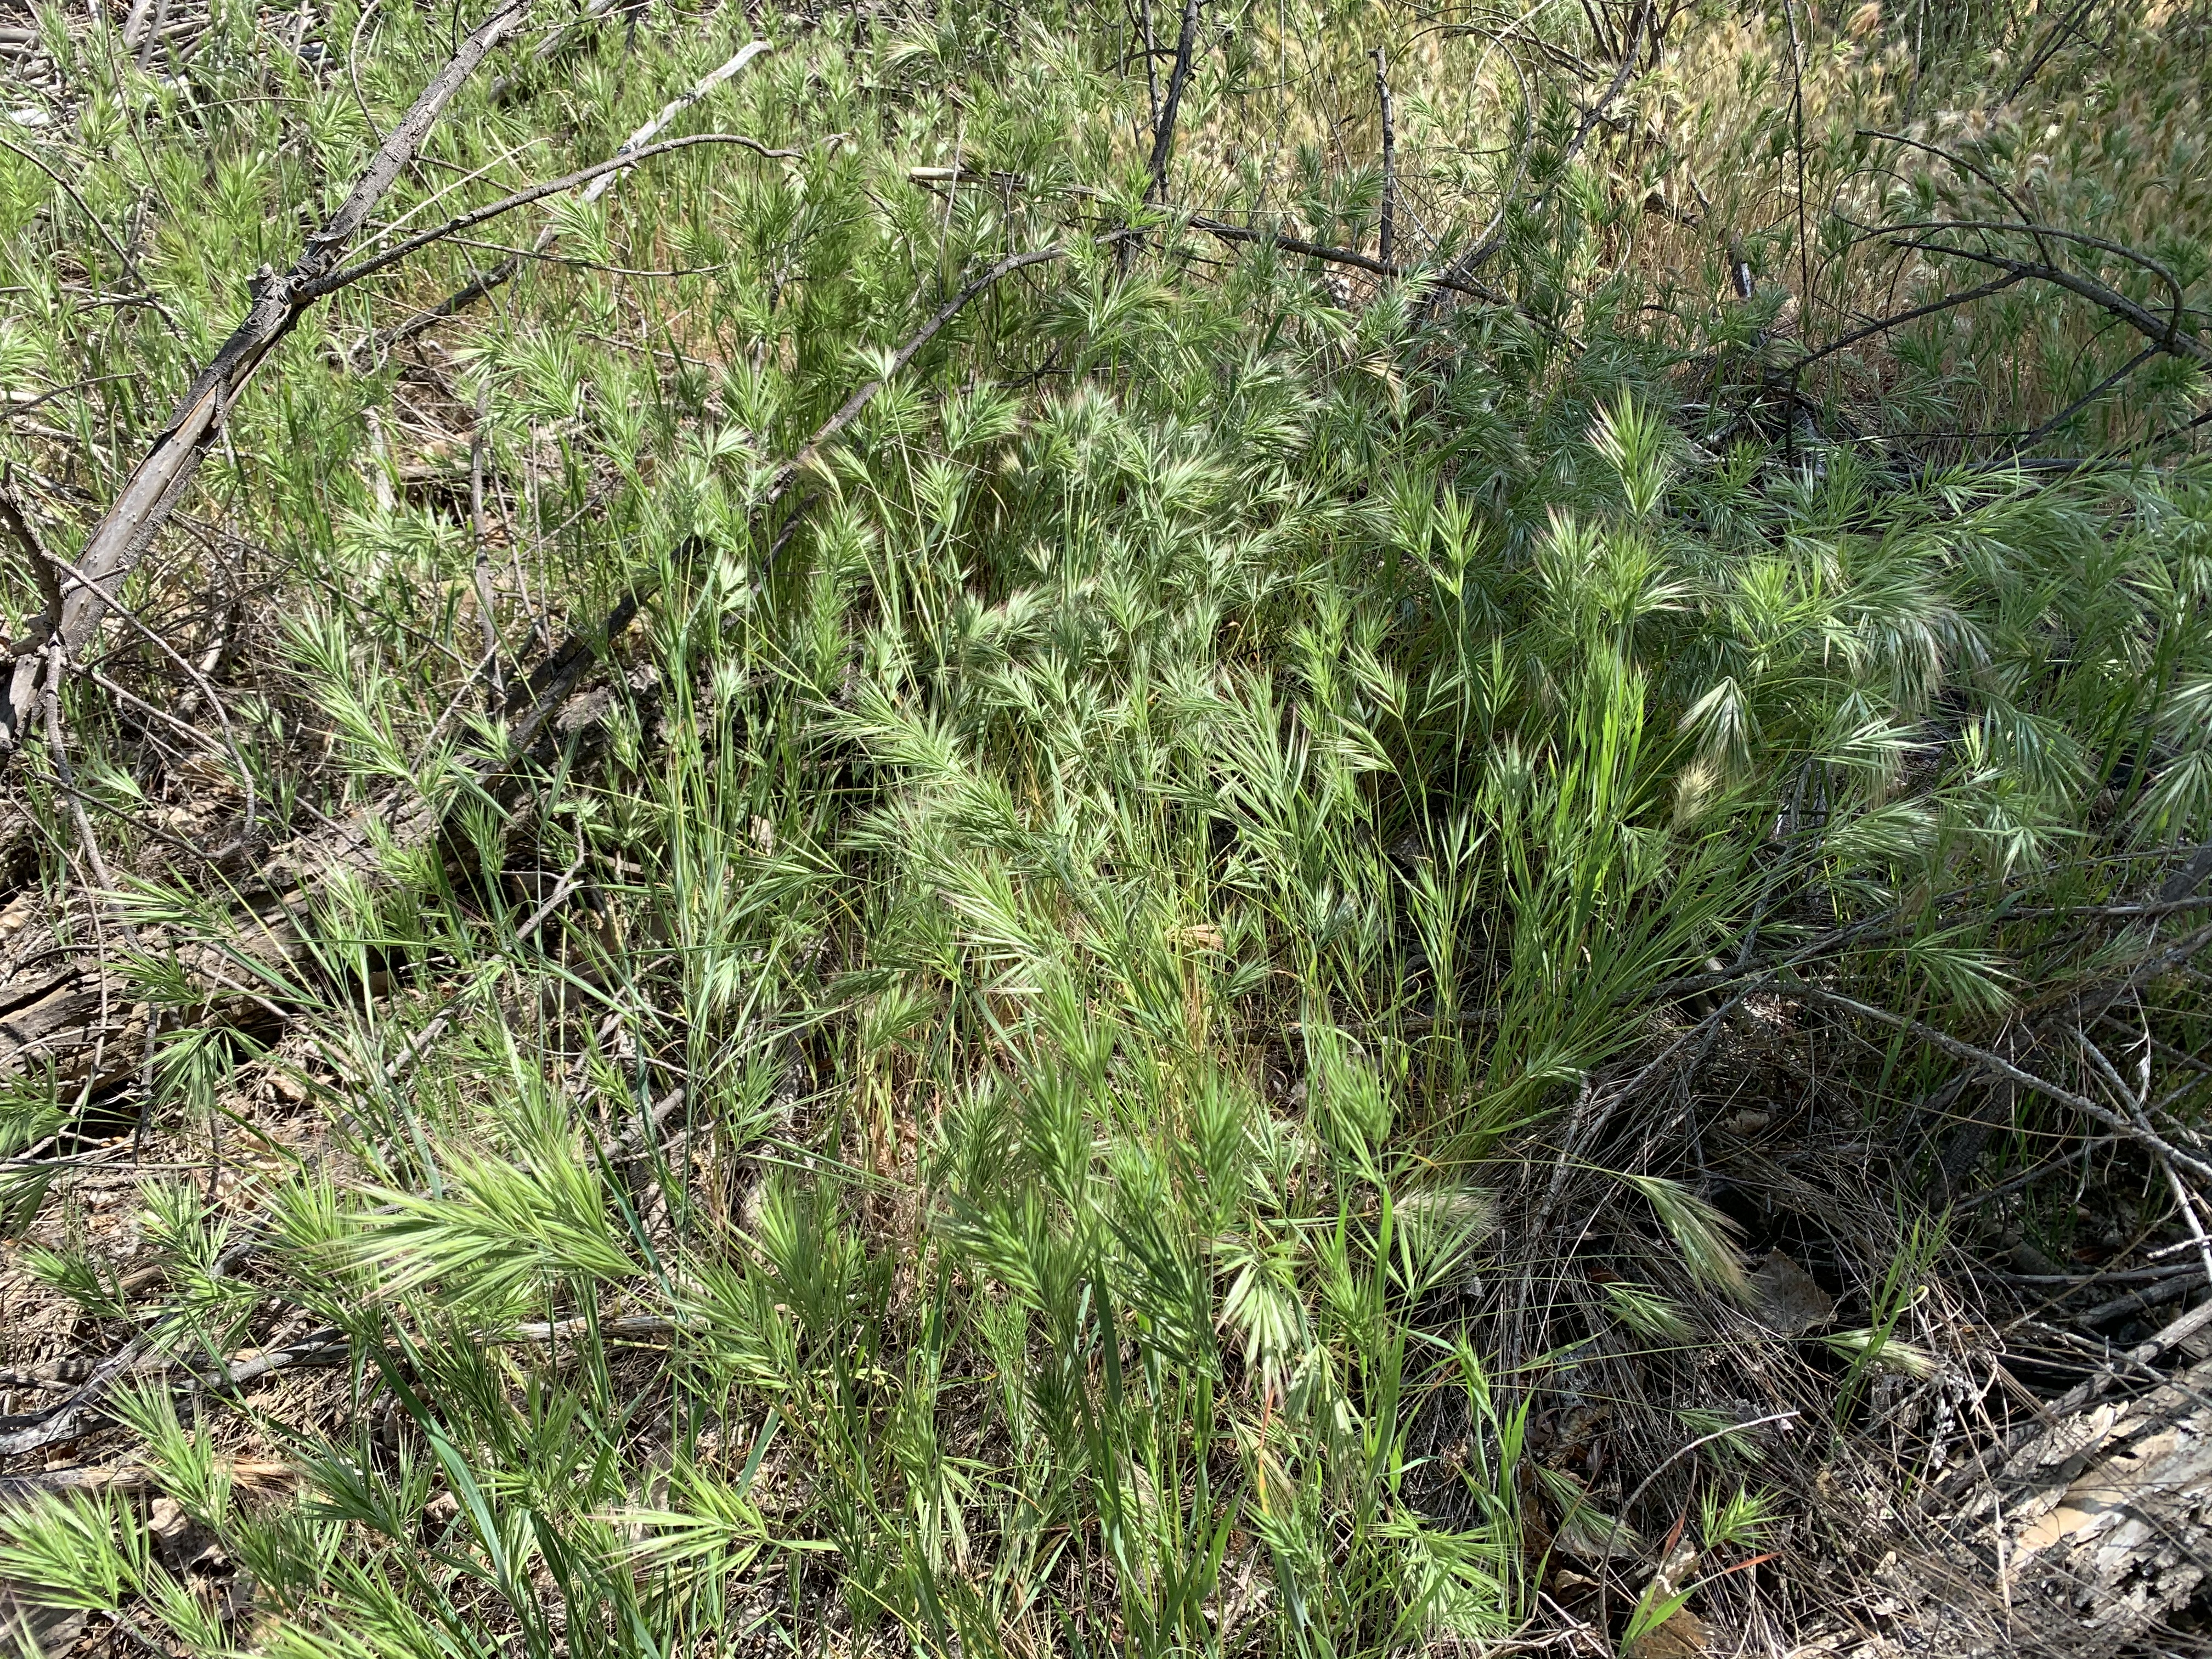
We forecast flowering and senescence in red brome based on growing degree days and daylength. The forecasts can support ranchers in timing grazing after grasses have grown enough to provide good forage, but prior to unpalatable flowering and seeding stages. This practice reduces the development of new seeds and subsequent spread of the species. The forecasts also support the interpretation of satellite imagery of grassland green up.
| Phenophase | GDD threshold* | Base temp | Start date | GDD method | Model origin | Source |
|---|---|---|---|---|---|---|
| Flowering | 1441oF | 23oF | Dec 1 | Simple average | AZ, CO, UT | Prevéy et al. 2024 |
| Senescence | 1049oF | 32oF | Jan 1 | Simple average | AZ, CO, UT | Prevéy et al. 2024 |
*The accumulations in this model are weighted by daylength, where the daily GDD accumulation is multiplied by the proportion of hours of daylight to the 24 hours in a day.
This product was created with the support of the US Geological Survey Fort Collins Science Center (Cooperative Agreement #G22AC00322).
More information on map development and re-use policy. Raster layers for red brome maps can be downloaded by using the USA-NPN Geoserver Request Builder.
Explore the forecast in our Visualization Tool.