These resources are appropriate for teaching undergraduate students skills in designing a study, conducting background research, and interpreting data.
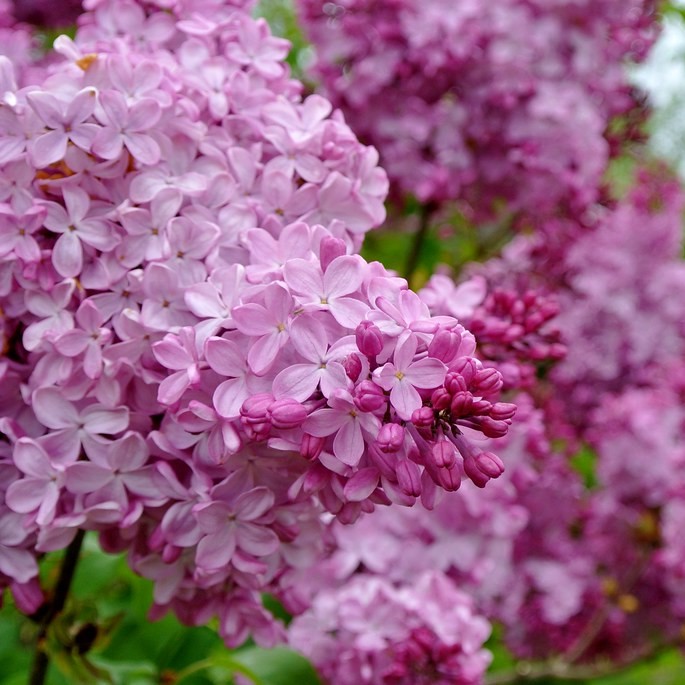
What can a Lilac Tell us About Climate Change?
Grades: Undergraduate
In this activity, your students will use the Spring Index Maps and USA-NPN Visualization tool to explore the timing of spring between their location and other areas of the country. They will also explore the overlap of phenology between two species in a single year.
Indoor activity; 60 minutes
Mapping and Graphing your Phenology Observations
Grades: Undergraduate
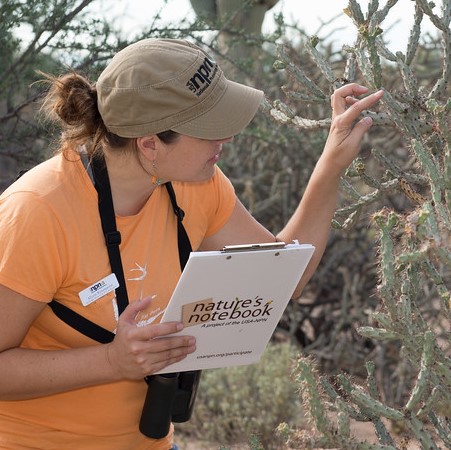
In this activity, your students will develop their own research field site, learn to make observations and collect data outdoors, build their own dataset, and then will learn how to plot, analyze, and draw comparisons of that data.
Outdoor activity; At least 7 class periods
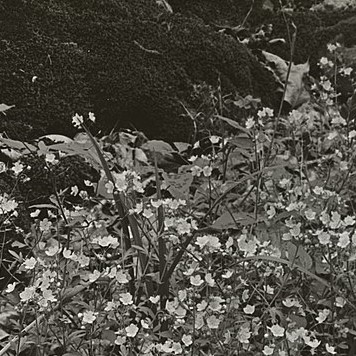
Phenology Snapshots
Grades: Undergraduate
In this activity, your students will conduct an investigation using historical photographic records to determine whether the timing of plant phenophases has changed in their own communities.
Indoor activity with some field trips; 3 class periods
Start a Local Phenology Program
We have the resources you need for your students to track seasonal changes with Nature's Notebook