How do you know when spring has begun? Is it the appearance of the first tiny leaves on the trees, or the first crocus plants peeping through the snow? The First Leaf and First Bloom Indices are synthetic measures of these early season events in plants, based on recent temperature conditions. These models allow us to track the progression of spring onset across the country.
How does this year's start to spring compare to "normal"?
May 18, 2026
Spring leaf out has arrived at all but the most northern and highest elevation parts of the country. While the start of spring has been slow to arrive along the Atlantic coast, it has been remarkably early this year in much of the West. At the start of the year, spring arrived over two weeks earlier than average (1991-2020) in Gulf Coast states, and then paused due to cold temperatures, arriving over a week late in parts of the Southeast. Spring then arrived 2-5 weeks early in the Central and Western US. Leaf-out has been the earliest on record (stretching back to 1981) in much of WY, MT, CO, NE, KS, and parts of ID, NV, and OR.
Spring bloom has been mostly early across the country, with central states seeing conditions for bloom 2-5 weeks earlier than average (1991-2020). The Atlantic coast is on time to a week early. Minneapolis, MN is on time, Rochester, NY is 2 days early, and Concord, NH is 3 days early.
The Late Bloom Index indicates when plants that bloom at the tail end of the season are flowering, effectively representing the end of the spring season. The end of spring has arrived days to weeks early across southern states. Parts of the Southwest, TX, OK, and AR are over 3 weeks early. Learn more about the new Late Bloom Index in our Seasonal Story.
Download the maps in KML/KMZ and other formats via our Geoserver Request Builder Tool. Explore the maps on our Visualization Tool (click the link to See Visualization under the "Where did spring arrive early this year?" story).
Spring First Leaf Index


Spring First Bloom Index


Spring Late Bloom Index


Get involved!
Your observations of leaf-out and flowering in cloned and common lilacs as part of the Cloned and Common Lilac Campaign are used to determine if these predictions are accurate. Help out by sharing valuable observations of your plant!
How are these maps used?
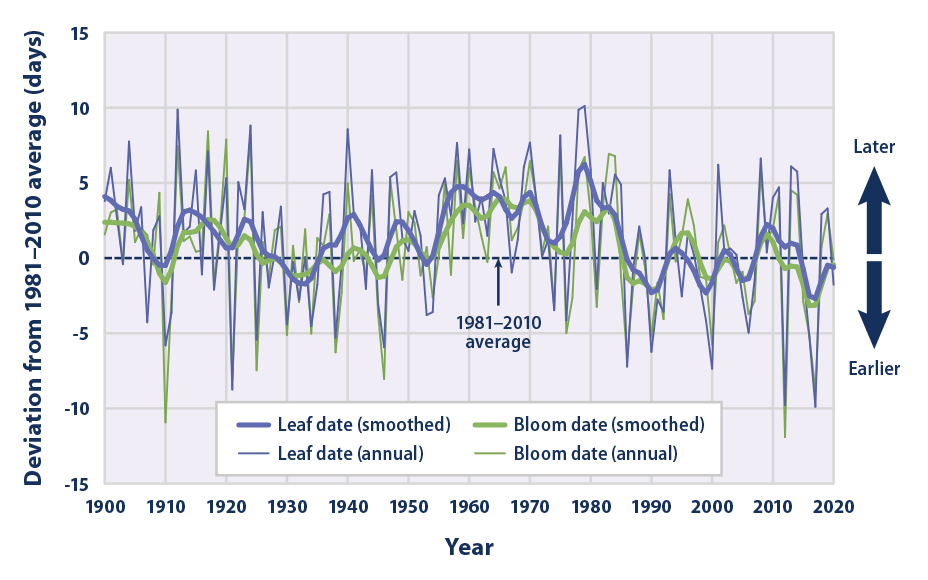
The Extended Spring Indices have been used as an indicator of climate change by both the Environmental Protection Agency and the National Climate Assessment. The product suite supports understanding of spatial patterns in the timing of spring, including short-term forecasts to support resource management. Recent work using this products shows advancement in the timing of spring across the US National Park Service.
When did spring arrive at locations across the country?
The First Leaf Index map shows locations that have reached the requirements for the Spring Leaf Index model this year.
The First Bloom Index map shows locations that have reached the requirements for the First Bloom Index model this year.
Check back on this page to see how spring unfolds this year.
Spring First Leaf Index

Spring First Bloom Index

What is the difference between first leaf and first bloom?
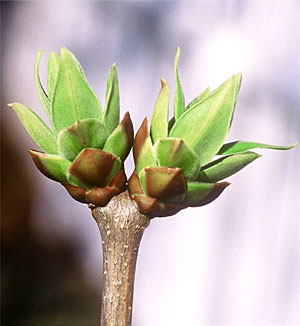
The First Leaf Index is based on the leaf out of lilacs and honeysuckles, which are among the first plants to show their leaves in the spring. This Index is associated with the first leafing of early-spring shrubs and other plants.
The First Bloom Index is based on the flowering of lilacs and honeysuckles. This Index is associated with blooming of early-spring shrubs and leaf out of deciduous trees.
See how the First Leaf and First Bloom predict activity of native trees and shrubs
What is behind these maps?
The Extended Spring Indices are mathematical models that predict the "start of spring" (timing of leaf out or bloom for species active in early spring) at a particular location (Schwartz 1997, Schwartz et al. 2006, Schwartz et al. 2013). These models were constructed using historical ground-baesd observations of the timing of first leaf and first bloom in a cloned lilac cultivar (S. x chinensis 'Red Rothomagensis') and two cloned honeysuckle cultivars (Lonicera tatarica 'Arnold Red' and L. korolkowii 'Zabelii'). These species were selected because they are among the first woody plants to leaf out and bloom in the springtime and are common across much of the country.
Primary inputs to the model are temperature and weather events, beginning January 1 of each year (Ault et al. 2015). Maps for the current year are generated using PRISM gridded temperature products and are available at 4 km spatial resolution. More information is provided in our Gridded Product Documentation.
To determine how the current spring compares to “normal”, we difference the day of year the leaf out or bloom was reached this year from the long-term average (1991-2020) day of year it was met. Long-term averages were calculated using PRISM Climate Data daily minimum/maximum temperature data (Oregon State University).
In 2022, we updated the period of comparison for our spring leaf out and bloom anomaly maps to the new climate normal of 1991-2020, following standards set by NOAA and the World Meteorological Organization. Climate Central offers more detail about how seasonal average temperatures have shifted from the prior to the current climate normal period.
To calculate how often we see a spring as early or late as the current spring, we compare the current year's Spring Index Anomaly value to the anomaly values from the previous decades. We determine how often a spring was at least this early (or late) by taking the number of years in the record divided by the count of years that were earlier (or later) than the current year.
Use of maps and data
Content, maps, and data accessible via usanpn.org are openly and universally available to all users. USA-NPN is not responsible for the content or the use of the data. Content may be re-used and modified with appropriate attribution (e.g., "source: USA National Phenology Network, www.usanpn.org"). See our complete Content Policy and Data Use Policy.
Recommended citation
Format: USA National Phenology Network. [Year Published] [Dataset Title] {as of [DOY] (for continuous daily data) | Year(s) [Year(s)] (for annual products) | Date [Date] (for daily products) } for Region [Coordinates]. [Parameterized URL for Data Download] USA-NPN, Tucson, Arizona, USA. Dataset Accessed [Date of Access] at http://dx.doi.org/10.5066/F7SN0723.
Example: USA National Phenology Network. 2017. Spring Indices, Current Year - First Bloom - Spring Index Date 2017-08-02. Region: 49.9375,-66.4791667,24.0625,-125.0208333. http://data.usanpn.org/geoserver-request‑builder?service=wms&layer=si‑x:average_bloom_ncep&date=2017‑08‑02&format=image/png&projection=4269&width=1700&height=800&colors=1 . USA-NPN, Tucson, Arizona, USA. Data set accessed 2017-8-2. http://dx.doi.org/10.5066/F7XD0ZRK
Data
Spring Index products available from USA-NPN include:
- Current year maps of Spring Index First Leaf, First Bloom, and Late Bloom dates
- Current year anomaly maps of First Leaf, First Bloom, and Late Bloom dates (current year compared to 30-year [1991-2020] mean)
- Annual First Leaf and First Bloom date maps, 1981-2025
- Annual Late Bloom date maps, 1991-2020
- 30-year (1991-2020) mean maps for First Leaf, First Bloom, and Late Bloom dates
- Annual First Leaf and First Bloom date maps, 1880-2013
Download Data Using the USA-NPN Geoserver Request Builder
- Raster Data Files (GeoTiff, ArcGrid, NetCDF)
- Map Image Files (PNG, TIF, GIF, PDF)
Web Services Available via the USA-NPN Geoserver (geoserver.usanpn.org/geoserver/wms? request=GetCapabilities)
Visualize the Data Using the USA-NPN Visualization Tool
- Extended Spring Index data can be viewed independently or in conjunction with in-situ plant or animal phenology observation data using the online USA-NPN Visualization Tool
Additional documentation
Daily Accumulated Growing Degree Day and Spring Index Maps information sheet
Map Products Documentation: Crimmins, T.M., R.L. Marsh, J. Switzer, M.A. Crimmins, K.L. Gerst, A.H. Rosemartin, and J.F. Weltzin. 2017. USA National Phenology Network gridded products documentation. U.S. Geological Survey Open-File Report 2017–1003. DOI: 10.3133/ofr20171003.
References
Ault, T. R., M. D. Schwartz, R. Zurita-Milla, J. F. Weltzin, and J. L. Betancourt, 2015. Trends and natural variability of North American spring onset as evaluated by a new gridded dataset of spring indices. Journal of Climate 28: 8363-8378.
Schwartz, M. D., 1997. Spring index models: an approach to connecting satellite and surface phenology. Phenology in seasonal climates I, 23-38.
Schwartz, M.D., R. Ahas, and A. Aasa, 2006. Onset of spring starting earlier across the Northern Hemisphere. Global Change Biology, 12, 343-351.
Schwartz, M. D., T. R. Ault, and J. L. Betancourt, 2013. Spring onset variations and trends in the continental United States: past and regional assessment using temperature-based indices. International Journal of Climatology, 33, 2917–2922, 10.1002/joc.3625.
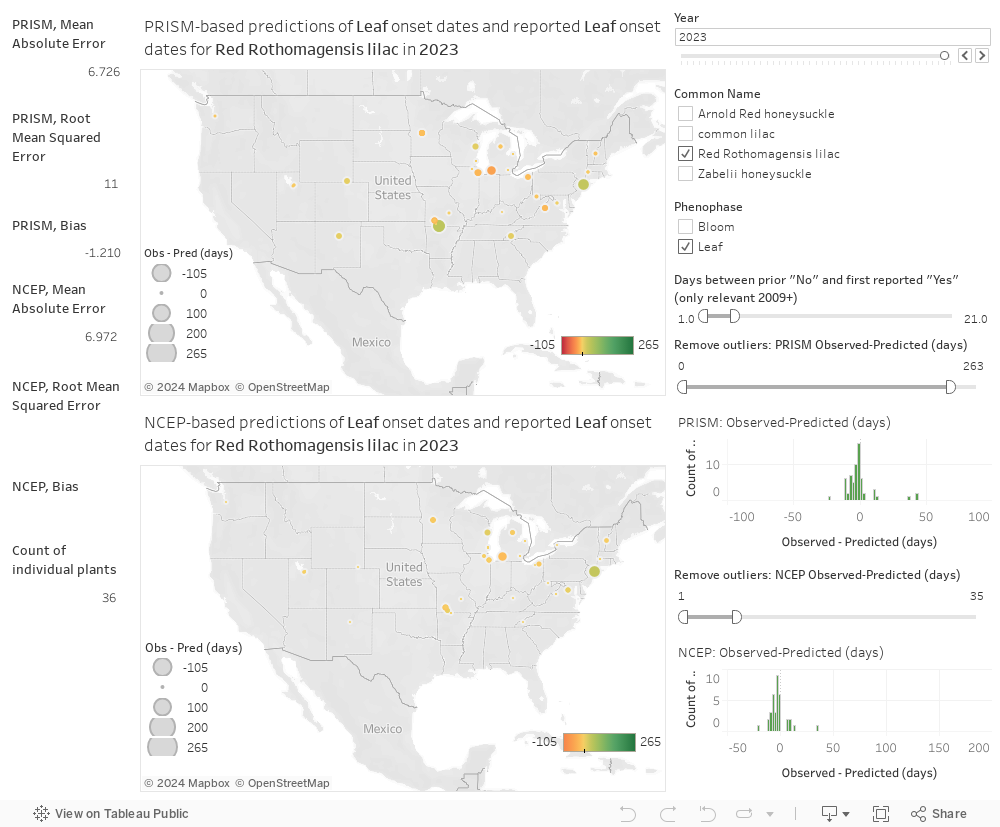
Estimating plausibility in Spring Index Products
To assess the plausibility of the species sub-models that comprise the Indices, we compare modeled output to observations of breaking leaf buds and open flowers on lilac and honeysuckle plants submitted by observers, in the Spring Index Plausibility Dashboard.
The USA-NPN's Extended Spring Indices, produced as map layers for the United States, combine modeled leaf out and bloom dates for lilacs and honeysuckles, resulting in a day of year for the start of spring. To assess the plausibility of the species sub-models that comprise the Indices, we compare modeled output to observations of breaking leaf buds and open flowers on lilac and honeysuckle plants submitted by observers.
The dashboard below shows the difference, in days, between the date of breaking leaf buds or open flowers reported for individual lilac and honeysuckle plants via Nature's Notebook to the date the event was predicted for the plant's location by the corresponding Extended Spring Index sub-model.
Negative values (observed-predicted) indicate that the Spring Index sub-model predicted the event (leaf out or bloom) later than an observer reported it. Positive values (observed-predicted) indicate that the Spring Index sub-model predicted the event earlier than it was reported by an observer.
- Top dashboard: Modeled vs observed plant phenology (models use PRISM temperature data; available 1981-Present)
- Bottom dashboard: Modeled vs observed plant phenology (models use NCEP URMA temperature data; available 2016-Present)
- Zabelii lilac observations ended in 2008.
For more details on our approaches and plans for estimating uncertainty in our gridded products, see Crimmins et al. (2017).