We are excited to unveil another new index of spring – the Late Bloom Index!
Spring is a season of beginnings
The start of spring is not a single point in time. If you observe phenology, you no doubt appreciate that the events that characterize spring – the emergence of leaves, opening of flower buds, arrival of migratory birds, and reappearance of insects – don’t all occur at the same time. Some events, like crocus emergence and red maple flowering are very early. Some events begin later; for example, oak trees begin to leaf out several weeks after red maples flower. Each species responds to unique cues to begin activity, leading to a continuum of onsets.
In temperate systems, temperature is the most important factor shaping when species initiate activity in the spring. To prevent them from accidentally emerging from hibernation or exposing tender tissues too early in the year, animals and plants have evolved mechanisms that internally track the amount of warmth they have experienced following winter. When early spring months are very warm, species are rapidly exposed to more heat and initiate activity earlier than is typical; cooler than average early spring conditions lead to a later start to activity.
Because spring is a continuum, with various events occurring over several months, it is possible for some events to occur earlier than normal and other events to occur later than normal at a location. This occurs because on a day-to-day basis, temperatures often fluctuate. It is not uncommon for temperatures to drift from warmer than normal to cooler than normal and back to warmer than normal again within a season, in response to weather patterns. As a consequence, it is possible for some phenological events to occur much earlier than average, and subsequent events to occur later than normal, in response to varying temperature conditions within the season.
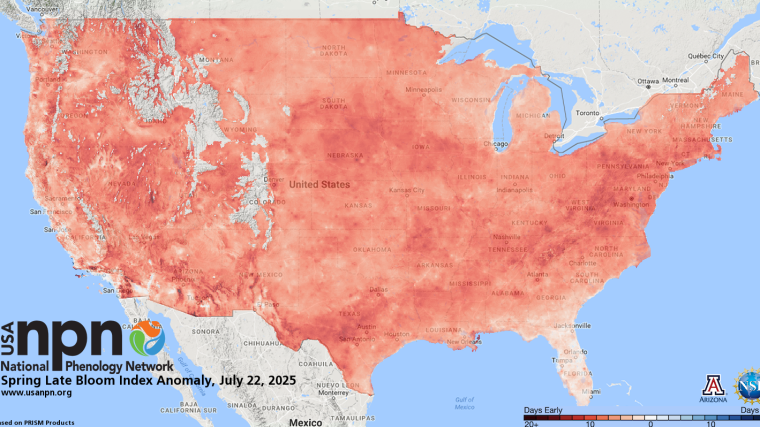
The USA-NPN’s three Spring Indices – the Leaf Index, the Bloom Index, and the new Late Bloom Index, reflect sets of conditions that are reached at various points in time over the course of the spring season. The Leaf Index is reached very early in the season; it indicates when the amount of warmth necessary to trigger leaf-out in very early-season species such as lilacs has been reached. The Bloom Index is typically reached several weeks later; it indicates when the amount of warmth necessary to trigger blooms in early flowering shrubs such as lilacs has accumulated. The Bloom Index also indicates when overstory canopy trees are beginning to leaf out. The new Late Bloom Index indicates when enough warmth has been accumulated to prompt the latest-flowering shrubs and trees, including black cherry and snowberry, to bloom. The combination of these three indices provides a more complete picture of how spring has unfolded at locations across the country.
Putting it into practice
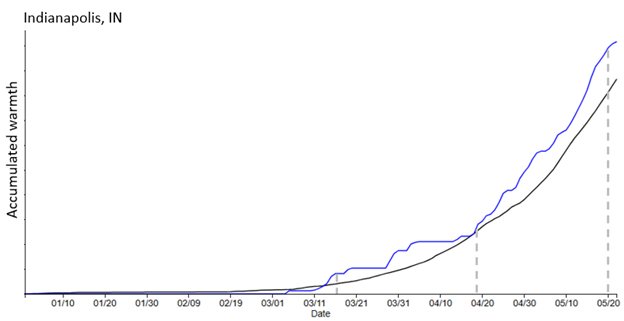
The plots below show how the accumulation of warmth at a location can lead to these different outcomes. In both, the black line indicates the average rate of warmth accumulation at a location. The orange and green lines depict the accumulation of warmth at that location in specific years. In both, the horizonal dashed lines represent the amount of warmth associated with one of the indices. The “barbells” below the plots indicate the dates that the indices are typically reached (black) and when the indices were reached in the years of interest (orange or green).
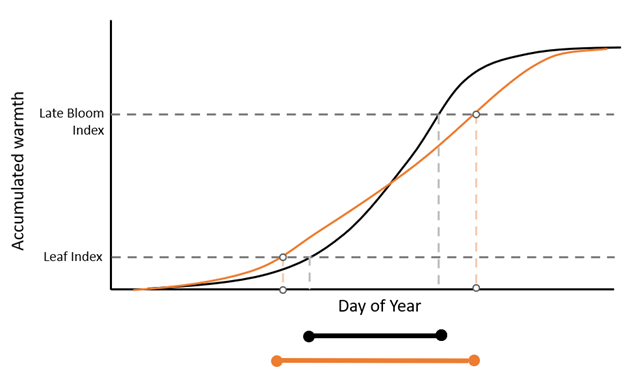
The plot above depicts a scenario where warmth was accumulated more quickly than average early in the year. The first index is reached earlier than average, shown by the orange line crossing the dashed line representing the Leaf Index earlier in the year. However, the Late Bloom Index is reached later than usual in this scenario as a consequence of a cool period and a slow-down in the rate of heat accumulation, shown as the orange line crossing the upper dashed line later in the year. The orange “barbell” below the plot indicates that more time elapsed between the two indices in this particular year than typically occurs.
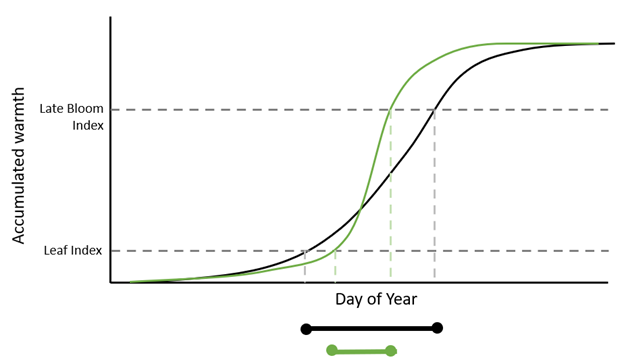
The plot above shows the opposite scenario, where the Leaf Index was reached later than normal due to cool conditions and slower than normal warmth accumulation early in the season. However, in this scenario, the Late Bloom Index was reached earlier than average, as a result of very warm conditions occurring after the Leaf Index was reached. As a result, as indicated by the green barbell, this results in a shorter span of time lapsing between the two indices in this particular year than typically occurs.
Seeing this in action in spring 2025
Let’s look at how warmth accumulated at a couple of locations this past spring and how this was reflected in the Spring Index maps.
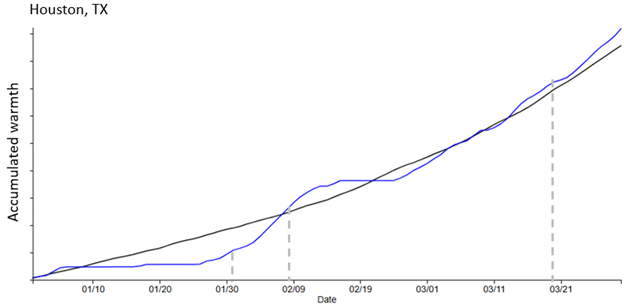
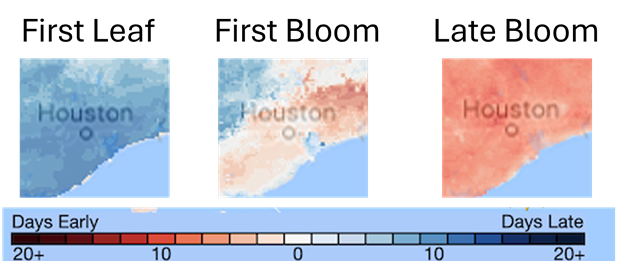
Temperatures were cooler than average throughout the month of January in Houston, TX. The Leaf Index was reached on Jan 31, nine days later than is typical for this location. However, a pulse of warmth bumped heat accumulation forward, and the Bloom Index was reached one day earlier than average in Houston, in early February. Warmth continued to accumulate for the next several weeks, ultimately resulting in in the Late Bloom Index being reached nearly a week early in late March.
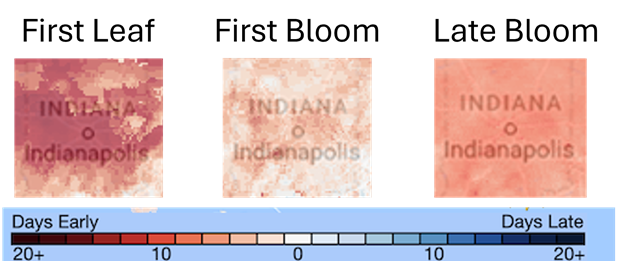
The story played out a bit differently further north, in Indianapolis, IN. The Leaf Index was reached over a week earlier than average, on Mar 15 this year. Heat accumulation stalled out in early April, when a cold spell parked over the region; the Bloom Index was reached only three days early, on Apr 19. However, warmer than average temperatures throughout late April and all of May led the Late Bloom Index to be reached eight days early, on May 20.
See what happened in your location this year
We invite you to check out the Late Bloom map and see when Late Bloom arrived in your location this year! You can also plug your zip code into our Visualization Tool Seasonal Story - How fast is it warming up this year where I live? - to see a graph of heat accumulation in your area.