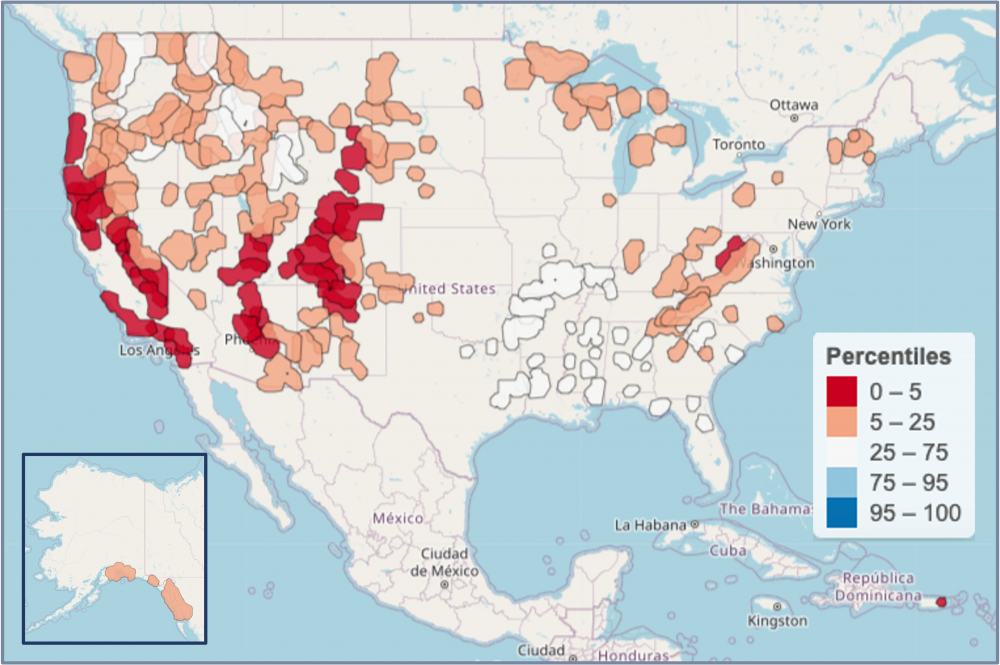
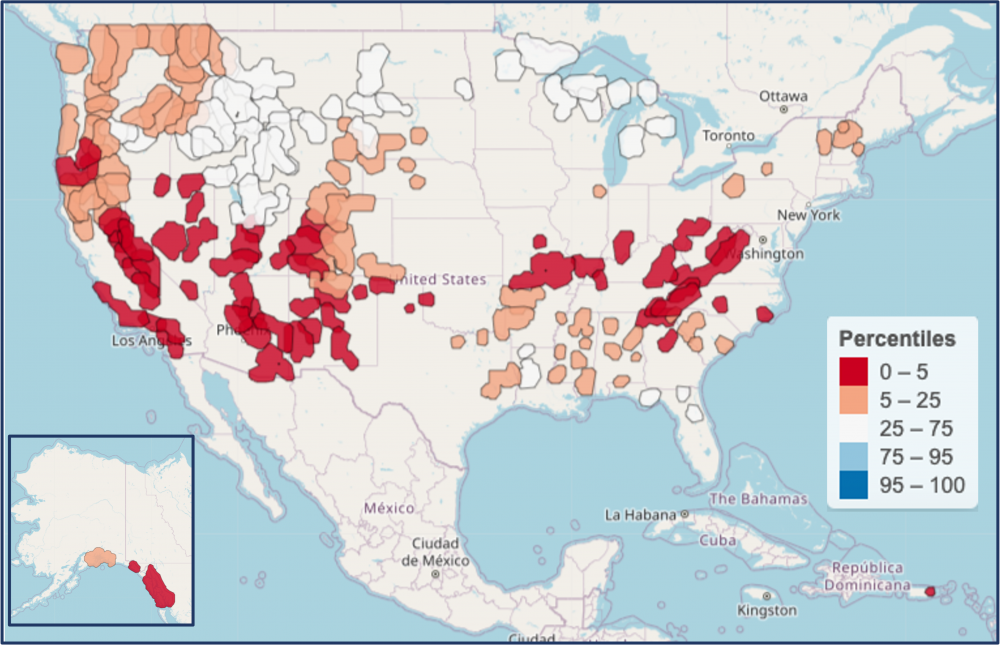
Climate change is already advancing the onset of spring across much of the United States. How is it playing out across the USFS National Forest System?
The maps above show the results of this effort for leaf out (left) and bloom (right). Red indicates units where the average spring arrival date across the most recent 10, 20 and 30 year moving windows falls in the earliest 5% of springs in the 120 year period (1900-2021). Pink indicates earlier spring, though less dramatically so, with recent springs falling in the 5th to 25th percentile of historic springs. For units in white, recent springs have been neither earlier nor later (the 25th to 75th percentile) than historic springs.
Leveraging an approach developed in collaboration with the National Park Service (Monahan et al., 2016), we are able to identify forest units where spring is arriving early in recent years compared to a 122-year record.
This approach leverages the USA-NPN's Spring Indices, models of spring onset developed using a long-term data set of early-season shrubs. Leaf out dates generally correspond to the earliest spring activity, while bloom corresponds to mid-spring activity. Here we use the Spring Index raster layers based on the Berkeley Earth dataset, which provides a long and robust period of record for looking at long-term changes, at a coarse spatial resolution (learn more).
Percentiles by Unit
The table below provides the data behind the maps (percentiles by unit for leaf and bloom; text file).
| Region | Forest | Leaf % | Bloom % |
|---|---|---|---|
| 1 | Beaverhead-Deerlodge National Forest | 33% | 36% |
| 1 | Bitterroot National Forest | 48% | 38% |
| 1 | Custer Gallatin National Forest | 8% | 26% |
| 1 | Dakota Prairie Grasslands | 8% | 30% |
| 1 | Flathead National Forest | 24% | 23% |
| 1 | Helena-Lewis and Clark National Forest | 13% | 30% |
| 1 | Idaho Panhandle National Forests | 19% | 12% |
| 1 | Kootenai National Forest | 25% | 14% |
| 1 | Lolo National Forest | 29% | 26% |
| 1 | Nez Perce-Clearwater National Forest | 15% | 16% |
| 2 | Arapaho and Roosevelt National Forests | 4% | 7% |
| 2 | Bighorn National Forest | 8% | 42% |
| 2 | Black Hills National Forest | 7% | 28% |
| 2 | Grand Mesa, Uncompahgre and Gunnison National Forests | 3% | 2% |
| 2 | Medicine Bow-Routt National Forest | 4% | 14% |
| 2 | Nebraska National Forest | 13% | 20% |
| 2 | Pike and San Isabel National Forests | 10% | 5% |
| 2 | Rio Grande National Forest | 3% | 7% |
| 2 | San Juan National Forest | 2% | 2% |
| 2 | Shoshone National Forest | 37% | 52% |
| 2 | White River National Forest | 3% | 4% |
| 3 | Apache-Sitgreaves National Forests | 5% | 3% |
| 3 | Carson National Forest | 4% | 5% |
| 3 | Cibola National Forest | 12% | 3% |
| 3 | Coconino National Forest | 2% | 3% |
| 3 | Coronado National Forest | 5% | 2% |
| 3 | Gila National Forest | 9% | 3% |
| 3 | Kaibab National Forest | 3% | 2% |
| 3 | Lincoln National Forest | 11% | 3% |
| 3 | Prescott National Forest | 2% | 3% |
| 3 | Santa Fe National Forest | 4% | 3% |
| 3 | Tonto National Forest | 2% | 3% |
| 4 | Ashley National Forest | 7% | 35% |
| 4 | Boise National Forest | 15% | 32% |
| 4 | Bridger-Teton National Forest | 43% | 51% |
| 4 | Caribou-Targhee National Forest | 10% | 29% |
| 4 | Dixie National Forest | 2% | 2% |
| 4 | Fishlake National Forest | 3% | 5% |
| 4 | Humboldt-Toiyabe National Forest | 6% | 5% |
| 4 | Manti-La Sal National Forest | 5% | 4% |
| 4 | Payette National Forest | 20% | 23% |
| 4 | Salmon-Challis National Forest | 50% | 47% |
| 4 | Sawtooth National Forest | 8% | 30% |
| 4 | Uinta-Wasatch-Cache National Forest | 6% | 27% |
| 5 | Angeles National Forest | 1% | 1% |
| 5 | Cleveland National Forest | 1% | 1% |
| 5 | Eldorado National Forest | 1% | 2% |
| 5 | Inyo National Forest | 3% | 3% |
| 5 | Klamath National Forest | 5% | 6% |
| 5 | Lake Tahoe Basin Management Unit | 2% | 2% |
| 5 | Lassen National Forest | 5% | 6% |
| 5 | Los Padres National Forest | 1% | 2% |
| 5 | Mendocino National Forest | 2% | 7% |
| 5 | Modoc National Forest | 10% | 19% |
| 5 | Plumas National Forest | 2% | 3% |
| 5 | San Bernardino National Forest | 1% | 1% |
| 5 | Sequoia National Forest | 1% | 2% |
| 5 | Shasta-Trinity National Forest | 4% | 8% |
| 5 | Sierra National Forest | 2% | 2% |
| 5 | Six Rivers National Forest | 3% | 10% |
| 5 | Stanislaus National Forest | 1% | 2% |
| 5 | Tahoe National Forest | 2% | 2% |
| 6 | Columbia River Gorge National Scenic Area | 27% | 23% |
| 6 | Colville National Forest | 24% | 12% |
| 6 | Deschutes National Forest | 15% | 16% |
| 6 | Fremont-Winema National Forest | 9% | 15% |
| 6 | Gifford Pinchot National Forest | 22% | 16% |
| 6 | Malheur National Forest | 25% | 34% |
| 6 | Mt. Baker-Snoqualmie National Forest | 15% | 9% |
| 6 | Mt. Hood National Forest | 24% | 19% |
| 6 | Ochoco National Forest | 23% | 28% |
| 6 | Okanogan-Wenatchee National Forest | 26% | 15% |
| 6 | Olympic National Forest | 14% | 11% |
| 6 | Rogue River-Siskiyou National Forests | 4% | 4% |
| 6 | Siuslaw National Forest | 4% | 18% |
| 6 | Umatilla National Forest | 15% | 24% |
| 6 | Umpqua National Forest | 6% | 3% |
| 6 | Wallowa-Whitman National Forest | 11% | 19% |
| 6 | Willamette National Forest | 13% | 8% |
| 8 | Chattahoochee-Oconee National Forests | 24% | 3% |
| 8 | Cherokee National Forest | 22% | 2% |
| 8 | Daniel Boone National Forest | 23% | 2% |
| 8 | El Yunque National Forest | 2% | 2% |
| 8 | Francis Marion and Sumter National Forests | 28% | 5% |
| 8 | George Washington and Jefferson National Forest | 9% | 2% |
| 8 | Kisatchie National Forest | 46% | 42% |
| 8 | Land Between the Lakes National Recreation Area | 27% | 2% |
| 8 | National Forests in Alabama | 30% | 13% |
| 8 | National Forests in Florida | 31% | 28% |
| 8 | National Forests in Mississippi | 37% | 23% |
| 8 | National Forests in North Carolina | 23% | 2% |
| 8 | National Forests in Texas | 28% | 21% |
| 8 | Ouachita National Forest | 40% | 11% |
| 8 | Ozark-St. Francis National Forest | 40% | 5% |
| 8 | Savannah River Site | 24% | 14% |
| 9 | Allegheny National Forest | 5% | 8% |
| 9 | Chequamegon-Nicolet National Forest | 11% | 39% |
| 9 | Chippewa National Forest | 9% | 37% |
| 9 | Green Mountain and Finger Lakes National Forests | 8% | 11% |
| 9 | Hiawatha National Forest | 21% | 41% |
| 9 | Hoosier National Forest | 9% | 2% |
| 9 | Huron-Manistee National Forest | 10% | 29% |
| 9 | Mark Twain National Forest | 25% | 4% |
| 9 | Midewin National Tallgrass Prairie | 21% | 11% |
| 9 | Monongahela National Forest | 3% | 2% |
| 9 | Ottawa National Forest | 16% | 48% |
| 9 | Shawnee National Forest | 25% | 3% |
| 9 | Superior National Forest | 19% | 38% |
| 9 | Wayne National Forest | 12% | 2% |
| 9 | White Mountain National Forest | 8% | 8% |
| 10 | Chugach National Forest | 9% | 12% |
| 10 | Tongass National Forest | 10% | 3% |

