The USA-NPN offers maps derived from MODIS 6 land surface phenology data. Satellite observations can be linked to in-situ observations to help understand vegetation dynamics across large spatial scales.
Description
The MODIS Land Cover Dynamics Product (MLCD) provides global land surface phenology (LSP) data from 2001-2017. MLCD serves a wide variety of applications and is currently the only source of operationally produced global LSP data. MLCD data have enabled important discoveries about the role of climate in driving seasonal vegetation changes, helped to create improved maps of land cover, and support ecosystem modeling efforts, among many other important applications.
The LSP Climate Indicators (LSP-CI) dataset is a curated collection of the most relevant phenological indicators: a measure of spring and autumn timing and a measure of seasonal productivity. Statistically robust estimates of long-term normals (median and median absolute deviation, MAD), significance-screened trends (Theil-Sen slope magnitude where p<=0.05), and interannual anomalies (in days as well as multiples of MAD) have been computed for these three phenological indicators. The data have been mosaiced across CONUS, reprojected and resampled to a more familiar spatial reference system that matches complementary datasets and delivered in the universally accessible GeoTIFF format.
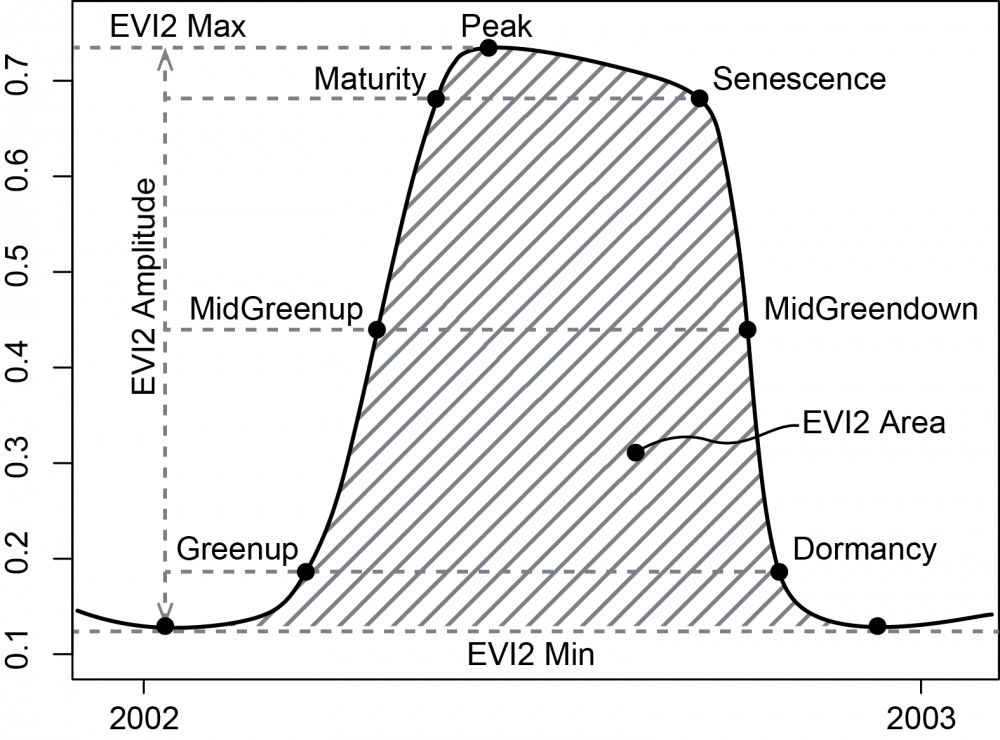
Diagram of MCD12Q2 phenometrics for a hypothetical vegetation cycle. Points indicate phenometrics recording timing information (dates) at which EVI2 reached particular fractions of the cycle's overall amplitude.
Purpose
These maps can answer questions, such as:
- Where has spring leaf-out occurred earlier in recent years?
- How variable is the timing of fall leaf color change across the United States?
- Where do we see the most total greenness across the growing season?
Recommended Citation
USA National Phenology Network. 2019. Land Surface Phenology 2001-2017 for the United States. USA-NPN, Tucson, Arizona, USA. Dataset Accessed [Date of Access] at www.usanpn.org/data/maps/land_surface_phenology.
Data
You can access the maps described below via WMS/WCS using the USA-NPN Geoserver Request Builder.
|
Mid Greenup Median (2001-2017)  The day of year that half of peak greenness occurs is considered an important metric of spring leaf-out. Greenness is calculated from satellite sensors that measure light reflectance from vegetation. Pixel values are the median day of year (2001-2017) the greenness of a pixel first reached 50% of the annual maximum. Negative values indicate that the greenup started prior to Jan 1 and the date of maximum greenness occurred after Jan 1. |
||
|
Mid Greendown Median (2001-2017)  The day of year half-way between peak greenness and senescence is considered an important metric of autumn leaf color change. Greenness is calculated from satellite sensors that measure light reflectance from vegetation. Pixel values are the median day of year (2001-2017) the greenness of a pixel last reached 50% of the annual maximum (i.e. during senescence). Values greater than 365 indicate that the greendown occurred after Dec 31 and the date of maximum greenness occurred prior to Dec 31. |
||
|
EVI area Median (2001-2017)  The total greenness that occurs between green-up and green-down is considered an important metric of productivity. Greenness is calculated from satellite sensors that measure light reflectance from vegetation. Pixel values are the median cumulative greenness (as measured by the 2-band Enhanced Vegetation Index) for an individual pixel. That is, summed daily values of EVI2 between greenup and greendown. |
||
|
Mid Greenup MAD (2001-2017)  Median Absolute Deviation (MAD) of MidGreenup days of year for the period 2001-2017. The MAD is a robust alternative to the standard deviation that captures variability in data. It is calculated as the median of the annual anomalies from the median of MidGreenup over the period 2001-2017. |
||
|
Mid Greendown MAD (2001-2017)  Median Absolute Deviation (MAD) of MidGreendown days of year for the period 2001-2017. It is calculated as the median of the annual anomalies from the median of MidGreendown over the period 2001-2017. |
||
|
EVI area MAD (2001-2017)  Median Absolute Deviation (MAD) of EVIarea for the period 2001-2017. It is calculated as the median of the annual anomalies from the median of EVIarea over the period 2001-2017. |
||
|
Mid Greenup TS Slope (2001-2017)  Theil-Sen slope magnitude for pixels where the associated p-value is less than or equal to 0.05. It represents the change (days per year) of the MidGreenup value over the period 2001-2017. The Theil-Sen estimator is more resistant to outliers than linear regression equivalents. It is calculated as the median of the slopes of lines between all possible point pairs (i.e. day of year of MidGreenup and its calendar year). |
||
|
Mid Greendown TS Slope (2001-2017)  Theil-Sen slope magnitude for pixels where the associated p-value is less than or equal to 0.05. It represents the change (days per year) of the MidGreendown value over the period 2001-2017. It is calculated as the median of the slopes of lines between all possible point pairs (i.e. day of year of MidGreendown and its calendar year). |
||
|
EVI area TS Slope (2001-2017)  Theil-Sen slope magnitude for pixels where the associated p-value is less than or equal to 0.05. It represents the change (integrated EVI2 units per year) of the EVIarea value over the period 2001-2017. It is calculated as the median of the slopes of lines between all possible point pairs (i.e. EVIarea and its calendar year). |
More Information
Funding for this effort was provided by NASA grant # NNH14ZDA001N awarded to Dr. Josh Gray at North Carolina State University.