Use this tool to explore your Local Phenology Program's site-based data. Get a quick snapshot of the number of phenology records per species, phenophase category, number of site visits, and active observers per month.
If you are seeking detailed phenological information for your site and the species you are observing, please visit the Phenology Observation Portal or the Phenology Visualization Tool. You may also wish to view our Data Dashboard to view an automated, up-to-the-minute summary metrics of the data.
How to use these dashboards
There are three separate dashboards on this page, each with its own set of Local Phenology Program/Network and Year selectors:
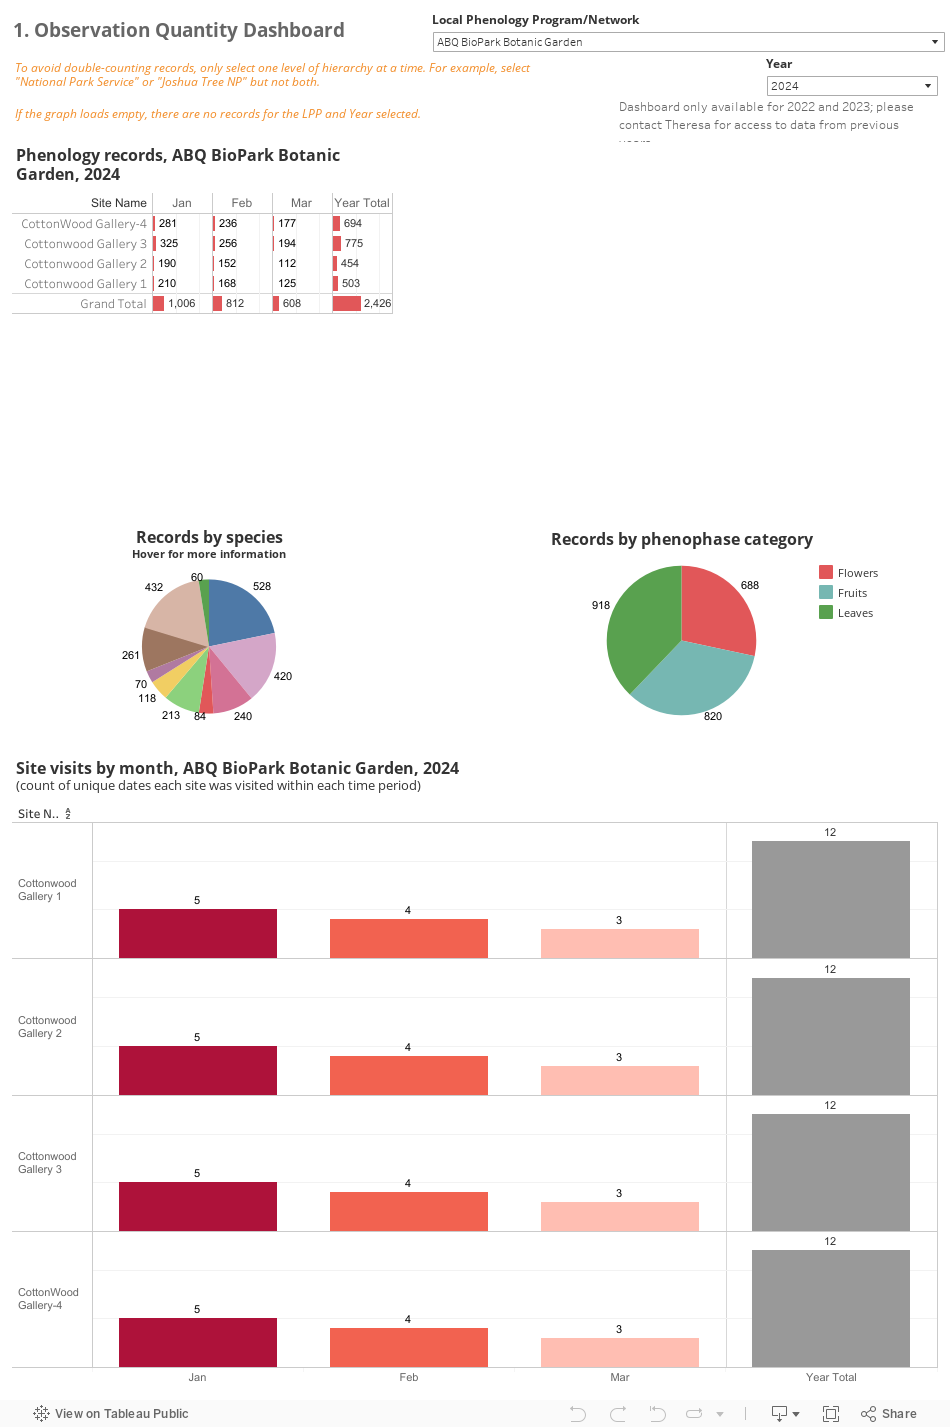
- Observation Quantity Dashboard - the number of observation records reported by site and month, number of records per species, number of records per Phenophase, and number of site visits by month
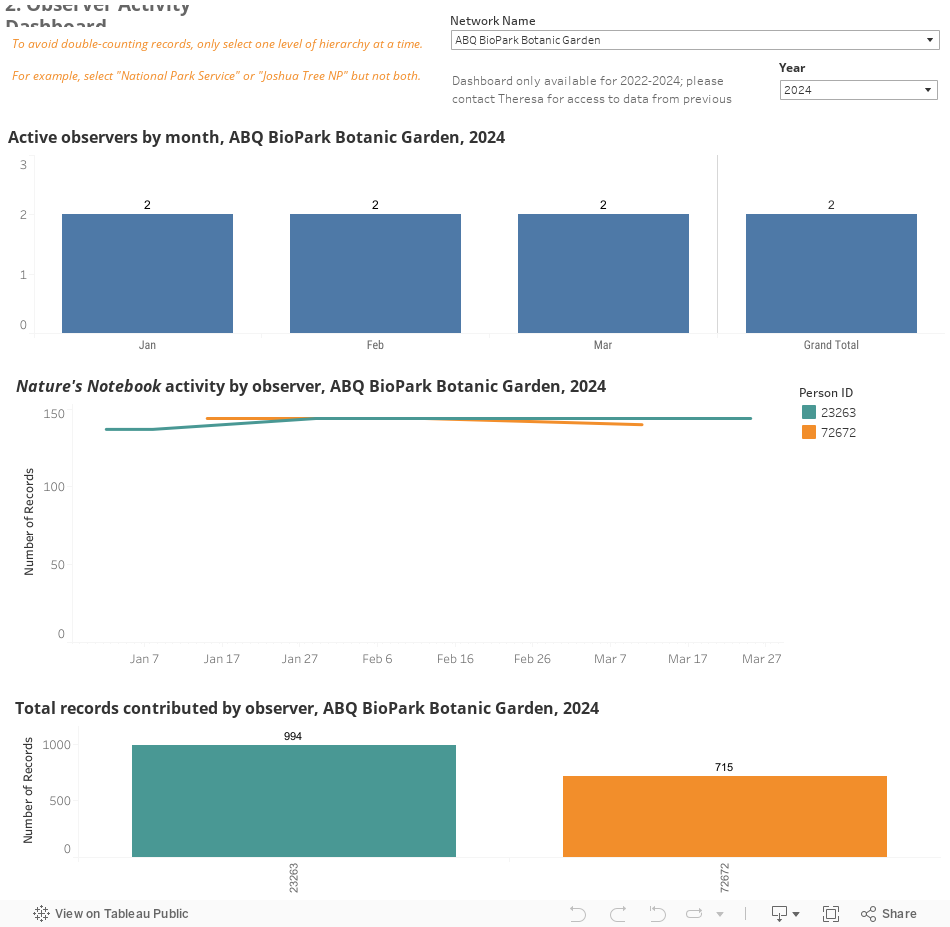
- Observer Activity Dashboard - the number of observers who have submitted data by month, the number of records submitted by each observer over the year, and the total number of records submitted by observer
- Registered Observers Dashboard - the number of observers who have registered with your Local Phenology Program in each year.
When selecting a Local Phenology Program or Network, be sure to only select units from one level of the hierarchy to avoid over-counting. For example, select either “National Park Service” or “Joshua Tree National Park”, but not both.
On the top dashboard, if you click on a red bar inside one of the graphs, the other graphs will adjust to reflect the selection.
There are Undo, Redo, and Reset buttons at the bottom of each dashboard.
To view the data underlying one of the blue graphs, click on a bar to make a selection. After a moment, options will appear: “Keep only,” “Exclude,” and an icon of a table. Click the table icon to view the underlying data. A summary will appear in the first tab, and Full data will appear in the second tab.
To save any of the graphics generated by the dashboard click on the tableau toolbar at the bottom of each dashboard. Click on the link for downloading and select the images you wish to save. You can save them as image files or PDFs and copy and paste individual images into separate reports.
In order for this dashboard to work in Safari, you must set the "Block Cookies" setting to Never.
Note that the phrase "phenology records" refers to an "observational record" or "status record" in our database, meaning a YES, NO, or ? response to one of the phenophase definitions in the protocol, rather than an "observation" which consists of the entire suite of phenophase status records.
Last updated: 4-17-24, next update in two weeks